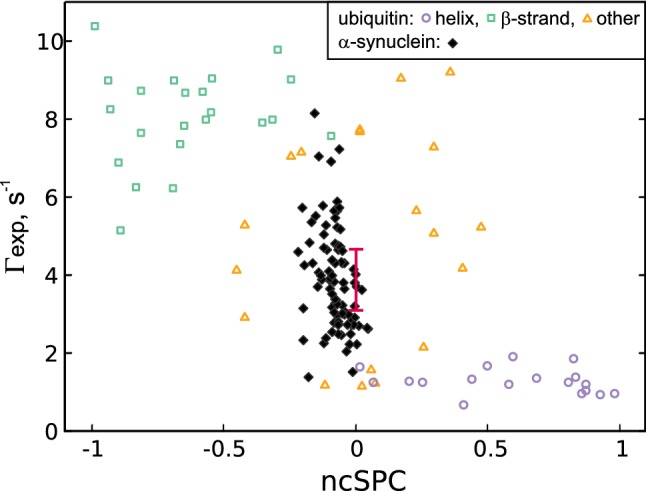
Fig. 7.

rates of Ubiquitin and -Synuclein plotted against their corresponding ncSPC scores. The data corresponding to Ubiquitin residues is plotted with empty markers corresponding to their secondary structure (as in PDB entry 1d3z): helix—circle, -strand—square, other—triangle. The data for -Synculein is plotted using filled markers. Expected values for random-coil-like residues are indicated by the error bar: Centered at 0 ncSPC, the bar indicates the expected range for (as described in the Methods—“Data analysis” section)
