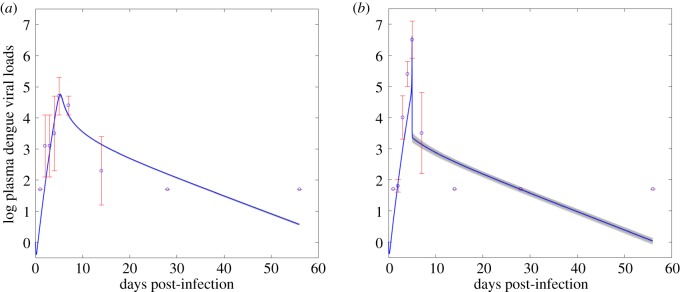
Figure 4.
Results of model fitting. (a) Fitting model (2.1) to the dengue viral loads from macaque infected with DENV only. (b) Fitting model (2.2) to the dengue viral loads from ZIKV convalescence macaque super-infected with DENV. The blue circles represent the mean dengue viral loads on log 10-scale, the error bars are their standard derivations, and the blue curve is the fitting curve.

