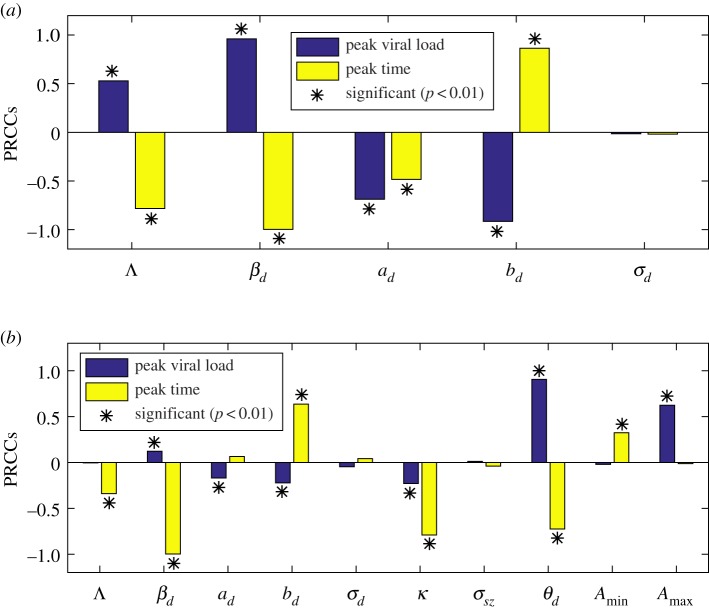
Figure 7.
Sensitivity analysis. (a) PRCCs of the peak dengue viral load and the peak time for the primary DENV-infection (i.e. model (2.1)); (b) PRCCs of peak dengue viral load and the peak time for the secondary DENV-infection with a previous ZIKV-infection (i.e. model (2.2)). ‘*’ denotes PRCCs that are significantly different from zero.

