Figure 2.

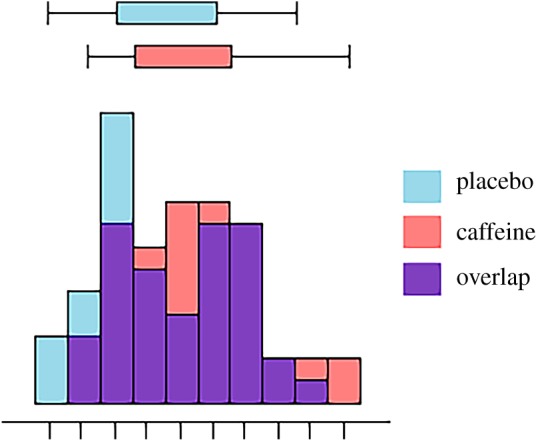
The boxplots and histograms show the mental rotation error rates for the two experimental conditions after caffeine administration.

The boxplots and histograms show the mental rotation error rates for the two experimental conditions after caffeine administration.