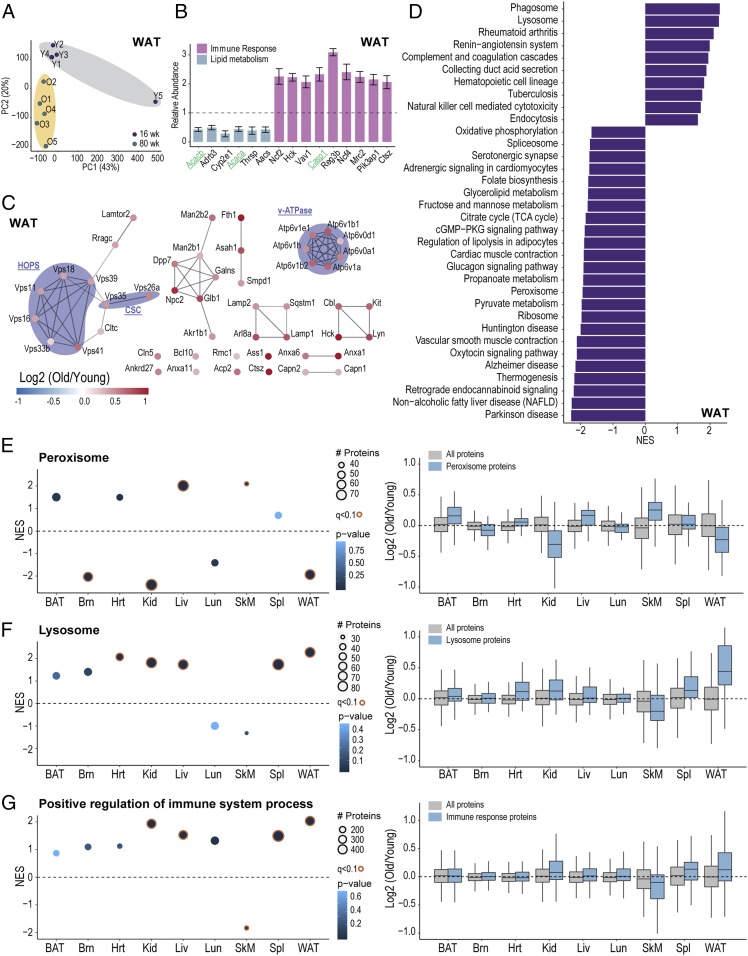
Fig. 6.
Tissue-specific changes in old mice revealed by proteome-wide profiling. (A) Principal component analysis (PCA) of WAT from 10 mice. (B) Example bar plots of proteins (n = 5, q < 0.05) that also have a minimum 2-fold change in WAT. Bars are colored according to primary pathway. Genes in green were also quantified by Tomahto. Bars represent mean ± SEM. (C) Network of significantly changed (n = 5, q < 0.05) lysosomal proteins in WAT. All genes were up-regulated in old mice. (D) Significantly enriched terms (q < 0.05) from GSEA analysis using all quantified WAT proteins (n = 5,797). (E) GSEA analysis for peroxisome gene set. NES and log2 ratio distribution are plotted for each tissue. (F) GSEA analysis result for the lysosome. NES and log2 ratio distribution are plotted for each tissue. (G) GSEA analysis result of positive regulation of immune system process. NES and log2 ratio distribution are plotted for each tissue.

