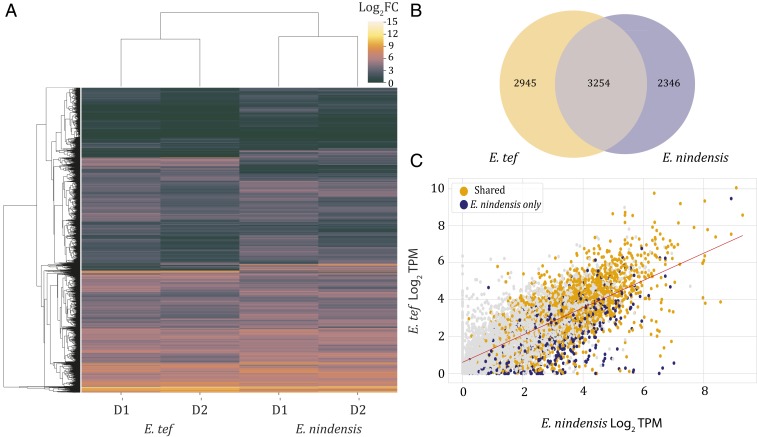
Fig. 3.
Shared and unique desiccation-associated expression changes. (A) Heatmap of shared and unique syntenic orthogroups up-regulated in drought/desiccation time points of E. tef and E. nindensis. D1 and D2 represent the first and second drought time point for E. nindensis and E. tef, respectively. (B) Venn diagram of shared and uniquely up-regulated syntenic orthogroups. (C) Correlation of expression, measured as log2 transcripts per million (TPM), between the syntenic orthogroups of E. tef and E. nindensis where syntenic orthogroups with similar up-regulation are shown in brown, and uniquely up-regulated orthogroups in E. nindensis are shown in blue.

