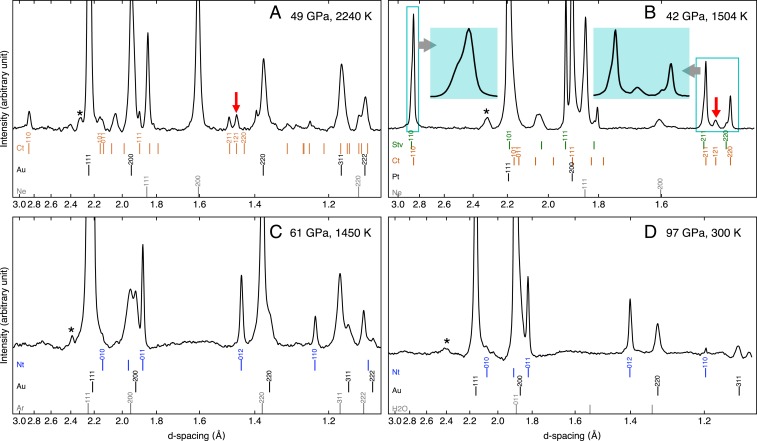
Fig. 1.
XRD patterns of hydrous silica polymorphs at high pressures. (A) Ct phase, (B) Stv + Ct phases, and (C and D) Nt phase. The ticks at the bottom of the diffraction patterns show the expected peak positions of Stv (green), Ct (orange), Nt (blue), pressure standard (black), and pressure medium (gray). B, Insets in light blue show two key areas for phase identification. The red arrows in A and B highlight the diagnostic 121 line of the Ct phase. The Miller indices are shown for the lines with more than 10% intensities. The backgrounds of the patterns are subtracted. The wavelength of the X-ray beam is 0.3344 Å except for in B, where 0.4066 Å was used. The pressures and temperatures presented here are for individual diffraction patterns, while the values shown in SI Appendix, Table S1 are averages over heating cycles. *These peaks are from laser mirrors.

