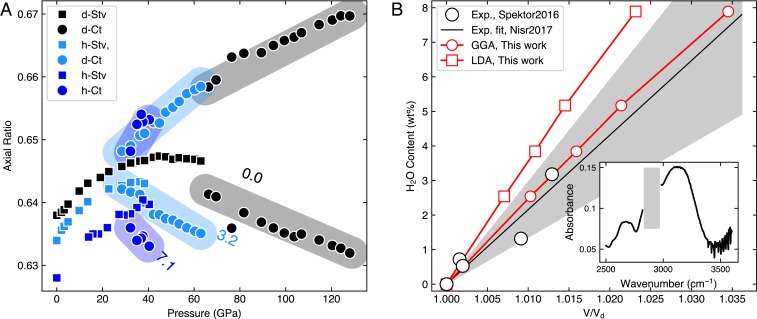
Fig. 2.
Effects of O incorporation on the Ct phase. (A) The axial ratios of Stv (squares) and Ct (circles) measured during decompression. The greater and smaller values for Ct are and , respectively. The numbers are the weight percentage of O contained in dense silica polymorphs: 0% from ref. 20 and 3.2% from ref. 10. (B) Relationship between unit-cell volume expansion ( is the unit-cell volume of dStv) and O content constructed from TGA and IR measurements (9, 21) (black circles). The gray area indicates uncertainties in the line fit of the data. We also include our DFT calculations (red symbols) for comparison. Inset shows the IR-active OH vibrational modes detected from a sample recovered from 45 GPa and 1740 K (the C–H peaks from diamond anvils and IR optics were masked with the gray rectangle). Some of the peak fitting results for A are presented in SI Appendix, Table S4. LDA, local density approximation. GGA, generalized gradient approximation.

