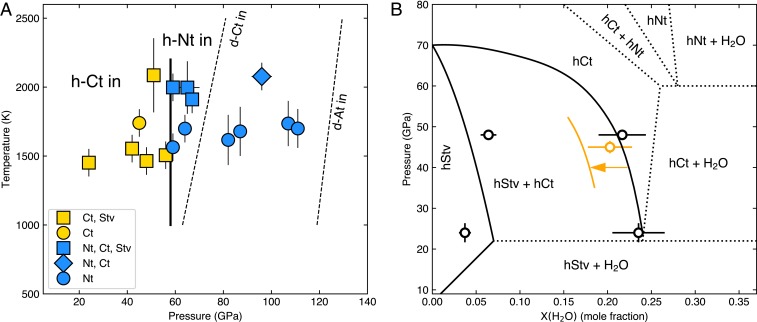
Fig. 3.
Conditions for observations of different hydrous silica phases. (A) Pressure–temperature conditions for the observations of different phases. The error bars are the estimated uncertainties. The vertical lines show the pressures where new polymorphs begin to appear. The phase boundaries in the anhydrous system (thin dashed lines) are shown for comparison (14, 15). (B) A provisional phase diagram of –O at 1400 to 1500 K (SI Appendix, section 6 has details). Although temperature is different, we also considered a data point with pure Ct from LHDAC (orange circle, 1700 K). The data point provides insights on temperature-dependent changes of the phase boundaries. d, anhydrous; h, hydrous.

