Fig. 2.
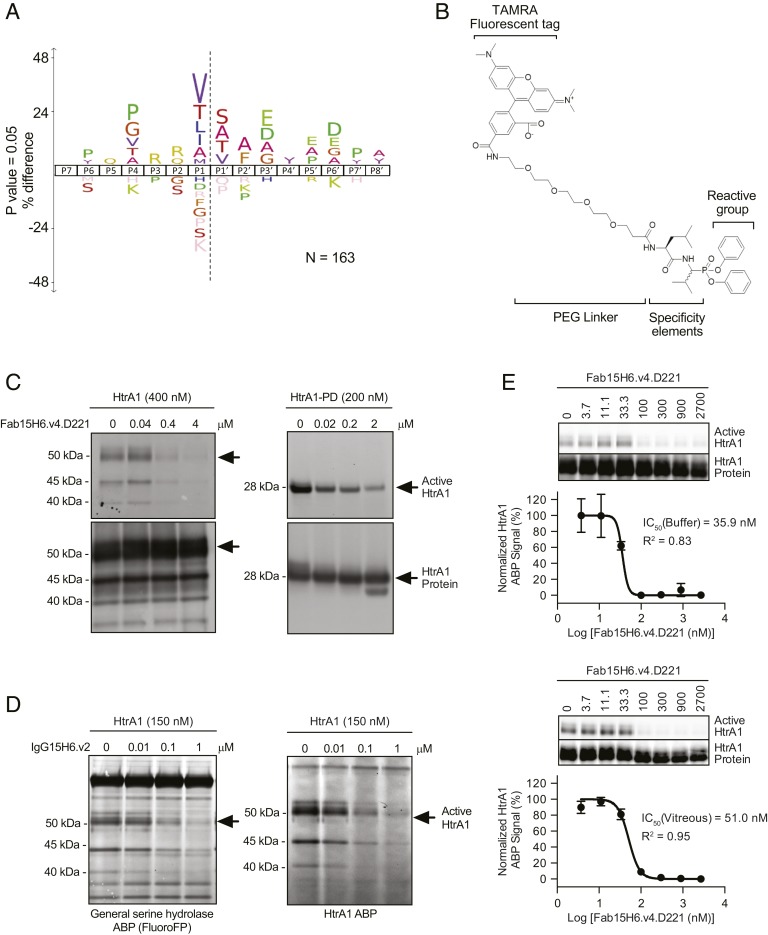
Design and characterization of a specific ABP for HtrA1. (A) The consensus sequence specificity of HtrA1 proteolytic cleavage of rat vitreous substrates in vitro was determined by N-terminomics and revealed a preference for hydrophobic residues at the P1 position in a variety of substrates present in the vitreous. The number of peptides used to generate the sequence logo was 163 and the iceLogo was generated using Rattus species as a reference set with a P value of 0.05. (B) Probe structure. (C) Preincubation of either HtrA1 or HtrA1-PD with a monoclonal antibody that inhibits proteolytic activity of HtrA1 (Fab15H6.v4.D221) blocked activity-based probe labeling in a concentration-dependent manner. Probe labeling was assessed by SDS/PAGE and visualized by fluorescent gel imaging (Top). Total protein was detected by immunoblotting with biotinylated anti-HtrA1:7816 19G10 followed by horseradish peroxidase-conjugated streptavidin (Bottom). Arrows indicate intact HtrA1 or HtrA1-PD on fluorescent gel images or immunoblots, respectively. Lower–molecular-mass bands are likely the result of HtrA1 autolytic activity and were determined to be cleaved HtrA1 migrating at different positions by N-terminal sequencing. (D) To evaluate ABP labeling in complex proteomes, HtrA1 was added to rabbit vitreous humor followed by labeling with a general serine hydrolase ABP (fluoroFP) or the HtrA1 ABP. While fluoroFP labeled many bands in vitreous humor, corresponding to the expected array of vitreal endogenous serine hydrolases, the HtrA1 ABP selectively labeled HtrA1 and labeling could be inhibited by preincubation with anti-HtrA1 IgG15H6.v2. Arrows indicate intact HtrA1 bands that were labeled by fluoroFP or HtrA1 ABP. Lower–molecular-mass bands were determined to be cleaved HtrA1 by immunoprecipitation with anti-HtrA1 antibody. (E) Inhibition of HtrA1 ABP labeling by anti-HtrA1 Fab15H6.v4.D221 in buffer and in vitreous humor. HtrA1 (200 nM) was labeled by HtrA1 ABP (10 μM) with and without anti-HtrA1 Fab15H6.v4.D221 (3.7 to 2,700 nM) pretreatment for 30 min. The intensities of active and total HtrA1 protein bands on fluorescent gel and Western blot images, respectively, were quantified by densitometric analysis and expressed as active/total ratios. The percentage of the HtrA1 ABP signal remaining assumes maximal response is 100% (control without antibody) and the maximally inhibited response is 0%. Data were fitted to a dose–response curve (GraphPad Prism) to calculate IC50 values. The values ±SEM are the average of triplicates. Representative gel and Western blot images are shown above each curve.

