Fig. 3.
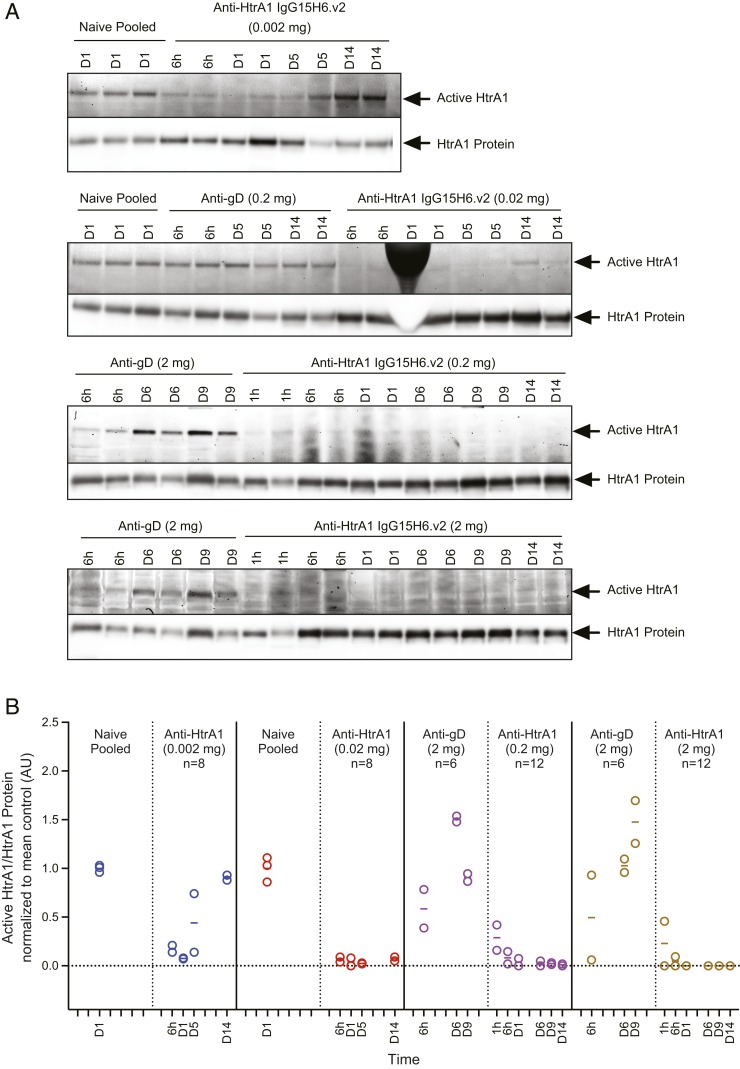
In vivo ABP labeling demonstrates activity of vitreous HtrA1 and inhibition by anti-HtrA1 (IgG15H6.v2) in rabbits. (A) Fluorescent gel images and Western blots for in vivo rabbit studies are shown. Arrows indicate active HtrA1 or total HtrA1 protein bands, respectively. Gel densitometric analysis of active and total HtrA1 bands was performed and expressed as ratios of active/total HtrA1 protein. Ratios were normalized to the mean value for the naïve pool or anti-gD controls that were analyzed on the same fluorescent gel image or blot. (B) Anti-HtrA1 IgG15H6.v2 was administered by ITV injection in rabbits followed by HtrA1 ABP labeling of harvested vitreous humor at different terminal time points post dose. The plot depicts densitometric quantification of active/total HtrA1 for each animal at terminal time points grouped by dose. Each data point represents an individual animal (with the exception of naïve pooled samples). Horizontal bars correspond to the average measurement per time point. Controls used for normalization are shown adjacent to their respective treatment groups. Solid vertical lines separate samples analyzed on different gels and blots. HtrA1 ABP labeling was completely blocked following anti-HtrA1 IgG15H6.v2 administration at 0.02, 0.2, and 2 mg per eye for at least 14 d. At the lowest dose (0.002 mg per eye) administered, HtrA1 activity rebounded to near-control levels on day 14.

