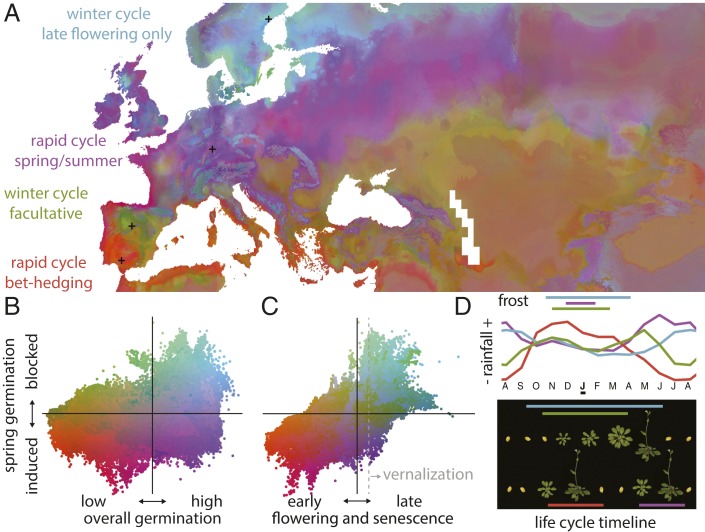
Fig. 1.
Distribution of seasonal timing adaptation of A. thaliana. (A) Map of predictions of plant’s time to flowering and senescence, temperature-independent germination rate, and cold-induced/blocked spring germination projected in a red–green–blue space. Black crosses indicate the locations of four ecotypes. (B and C) Relationships between the three variables centered on their averages. The gray dotted line indicates 290 d to senescence, which approximately coincides with the strict requirement of vernalization to flower (8). (D) Months with minimum temperature below 0 °C and monthly precipitation for the four locations in A of representative natural ecotypes: Tri-0 from south Spain (1001 Genomes Project identification code: 9900), Fun-0 from central Spain (1001 Genomes Project identification code: 9542), Hi-4 from Germany (1001 Genomes Project identification code: 9782), and Dör-10 from Sweden (1001 Genomes Project identification code: 5856). Grayscale maps are at https://doi.org/10.6084/m9.figshare.11724039.

