FIGURE 3.

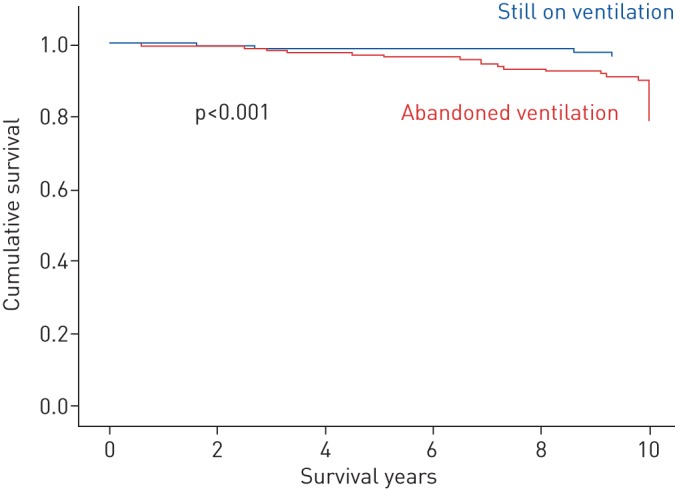
A survival curve of patients with obstructive sleep apnoea according to their ventilation therapy status. Adjustment was performed for the Charlson Comorbidity Index.

A survival curve of patients with obstructive sleep apnoea according to their ventilation therapy status. Adjustment was performed for the Charlson Comorbidity Index.