
FIGURE 4.
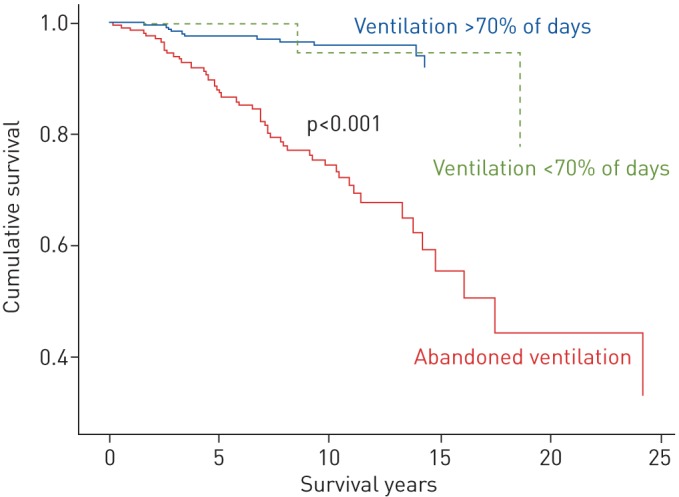
An adjusted survival curve for obesity hypoventilation syndrome and obstructive sleep apnoea patients according to ventilation status and percentage of days on which ventilation was used.
Official websites use .gov
A
.gov website belongs to an official
government organization in the United States.
Secure .gov websites use HTTPS
A lock (
) or https:// means you've safely
connected to the .gov website. Share sensitive
information only on official, secure websites.
An adjusted survival curve for obesity hypoventilation syndrome and obstructive sleep apnoea patients according to ventilation status and percentage of days on which ventilation was used.