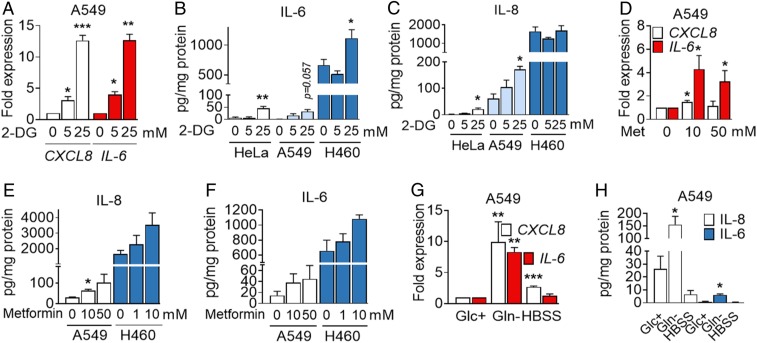
Fig. 2.
2-DG, metformin (Met), and glutamine deprivation induces IL-6 and IL-8. (A) A549 cells were treated with 2-DG for 6 h. qPCR for CXCL8 and IL-6 is shown. Values were normalized to control sample at 0 mM 2-DG. Data are represented as mean ± SEM (n = 3–4). Asterisks denote significant differences with the 0-mM sample for each cytokine. (B and C) A549, HeLa, and H460 cells were treated with 2-DG for 24 h at indicated concentrations. ELISA values for IL-6 (B) and IL-8 (C) are shown. Data represent mean ± SEM (n = 3–4). Asterisks denote significant differences versus the 0-mM control sample for each cell line. (D) A549 cells were treated for 6 h with metformin at indicated concentrations. qPCR for CXCL8 and IL-6 is shown. Values are normalized to cells treated without the drug. Data are represented as mean ± SEM (n = 4). Asterisks denote significant differences versus the 0-mM control sample. (E and F) A549 and H460 cells were treated for 24 h as in D. ELISA is shown for IL-8 (E) and IL-6 (F). Data are represented as mean ± SEM (n = 3). Asterisks denote significant differences vs. the control for each cell line. (G) A549 cells were incubated in 25 mM (Glc+) glucose, 0 mM glutamine (Gln−) medium or HBSS for 6 h. qPCR is shown for CXCL8 and IL-6. Values were normalized to Glc+. Data represent mean ± SEM (n = 3). Asterisks denote significant differences vs. Glc+. (H) A549 cells were incubated with Glc+, Gln− medium, or HBSS for 24 h. ELISA is shown for IL-8 and IL-6. Data indicate mean ± SEM (n = 3–4). Asterisks denote significant differences versus Glc+. Error bars represent the SEM. The significance was indicated as follows: *P < 0.05; **P < 0.01; ***P < 0.001.

