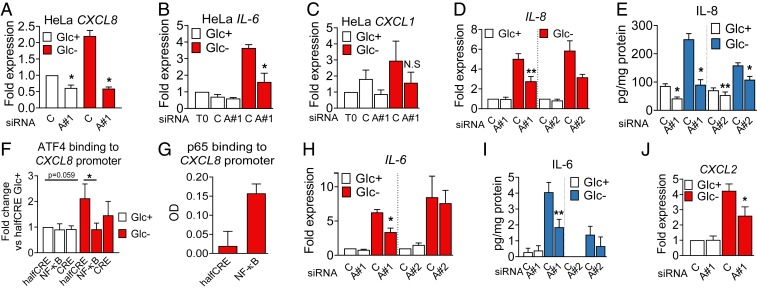
Fig. 4.
ATF4 regulates cytokine mRNA and secretion in HeLa and A549 cells. (A–C) HeLa cells were transfected for 24 h with nontargeting siRNA (labeled as ‘’C” for Control siRNA) or siRNA against ATF4 (labeled “A#1” for ATF4 sequence 1). After 24 h, cells were washed and incubated in 25 (Glc+) or 2 mM glucose (Glc−) media. qPCR for CXCL8 (A), IL-6 (B), and CXCL1 (C) is shown. Data are represented as mean ± SEM (n = 3). Fold expression was calculated by normalizing to the control siRNA in Glc+ conditions or time = 0 (T0) (before treatment). Asterisks denote significant differences of ATF4-transfected cells versus the control siRNA in each culture medium. N.S. means not significant. (D, E, and H–J). A549 cells were transfected for 40 h as described in A as well as with siRNA against ATF4 (labeled “A#2” for ATF4 sequence 2) and treated with 25 mM (Glc+) or 0 mM (Glc−) glucose for 6 h (D, H, and J) or 24 h (E and I). qPCR data for CXCL8 (D), IL-6 (H), and CXCL2 (J) were normalized to the control siRNA of Glc+. ELISA is shown for IL-8 (E) and IL-6 (I). Data are represented as mean ± SEM (n = 3–5). Asterisks denote significant differences of ATF4-transfected cells versus the control siRNA in each culture medium. (F and G) A549 cells were treated for 6 h with 25 mM (Glc+) or 0 mM (Glc−) glucose (F), or with 25 mM glucose and 10 ng/mL TNFα (G). Cells were harvested and processed for qDPI-ELISA as described in SI Appendix for ATF4 (F) and p65 (G). Values represent mean ± SEM after normalization to the value of halfCRE-containing oligo Glc+ (F, n = 4) or average of optic density values (OD) (G, n = 2). Asterisks indicate significant differences by two-way ANOVA. Error bars represent the SEM. The significance was indicated as follows: *P < 0.05; **P < 0.01.

