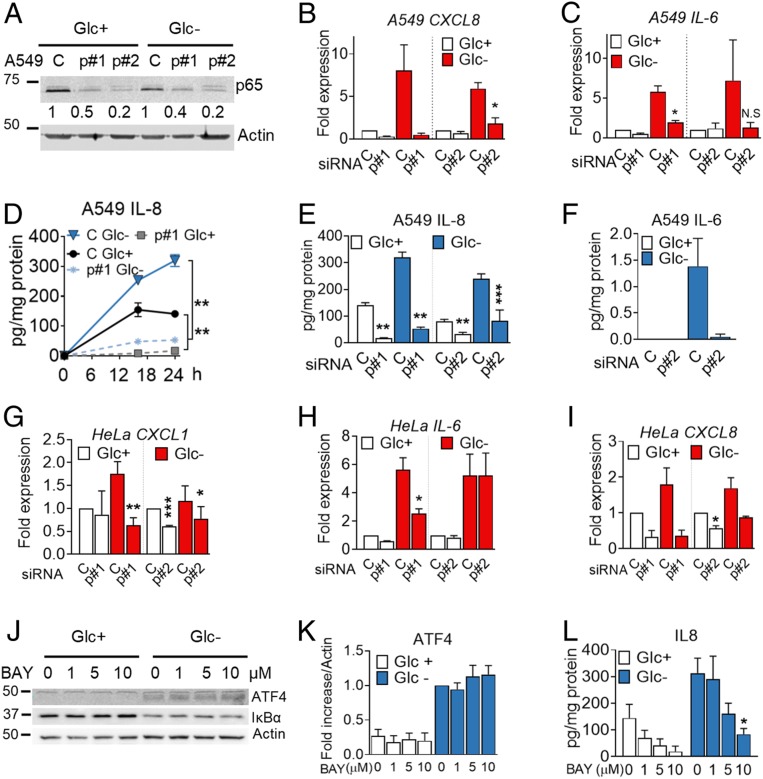
Fig. 5.
The p65 NF-κB subunit regulates cytokine synthesis and secretion. (A–F) A549 cells were transfected for 40 h with control nontargeting siRNA (labeled as “C”) or siRNA for p65 (labeled as “p#1” for sequence 1 and “p#2” for sequence 2). Western blot of p65 is shown in A. Cells were subsequently incubated with media containing 25 mM (Glc+) or 0 mM (Glc−) glucose for 6 h (B and C), for 16 and 24 h (D), or for 24 h (E and F). qPCR for CXCL8 (B) or IL-6 (C) was performed. Values were normalized versus control siRNA in Glc+. IL-8 (D and E) and IL-6 (F) were analyzed by ELISA. Results show mean ± SEM (n = 3–4). Asterisks denote significant differences of p65-transfected cells versus the control siRNA in each culture medium. N.S. means not significant. (G–I) HeLa cells were transfected for 24 h with siRNA (as in A) and treated for 24 h with 25 mM (Glc+) or 2 mM (Glc-) glucose. qPCR for CXCL1 (G), IL-6 (H) and CXCL8 (I) is shown. Values are normalized versus the control siRNA in Glc+. Results show mean ± SEM (n = 4). Asterisks denote significant differences of p65-transfected cells versus the control siRNA in each culture medium. (J–L) A549 cells were treated with the NF-κB inhibitor (BAY11-7082 [BAY]) at concentrations shown with media containing 25 mM (Glc+) or 0 mM (Glc−) of glucose for 16 h. Western blot of ATF4 and IκBα is shown in J. ATF4 (K) (n = 4) was quantified and normalized to actin. Fold induction was calculated vs. Glc− control sample. IL8 (L) was analyzed by ELISA after treating as in J. Results show average ± SEM (n = 4). Asterisks denote significant differences of treated cells vs. the 0-mM control of each of the culture media. Error bars represent the SEM. The significance was indicated as follows: *P < 0.05; **P < 0.01; ***P < 0.001.

