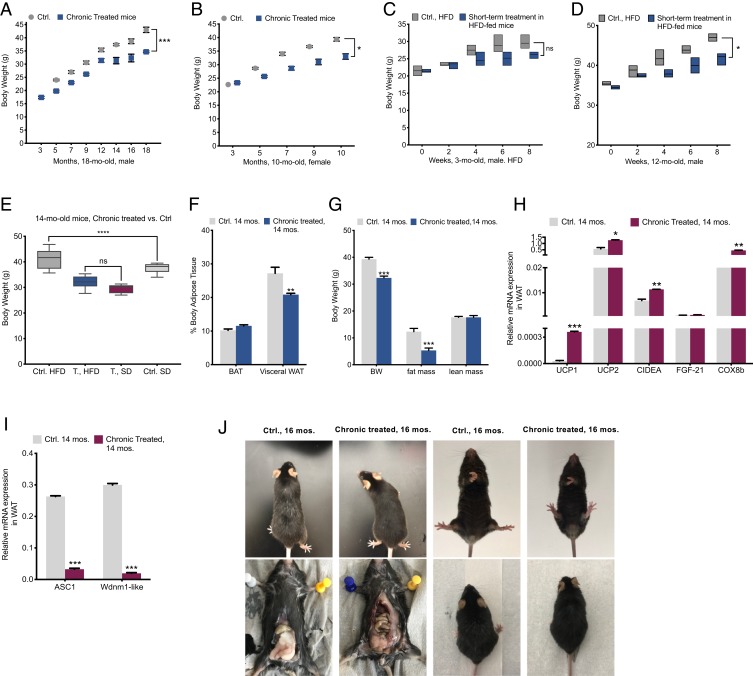
Fig. 3.
Reversed age-associated obesity. (A and B) Analyses of BW variations in groups of male mice for 18 mo (n = 10 per group) and female mice for 10 mo (6 = Ctrl, 8 = treated). (C and D) Eight-week-long-HFD (60% fat) analyses of BW variations among groups of aged (12 mo old) and young (3 mo old), short-term treated (treatment was begun 1 mo before the change of diet) and control (n = 6 per group). (E) Eight-week-long BW comparisons among SD- and HFD-fed chronically treated 14-mo-old mice vs. control (n = 6 per group). (F) BW, fat mass and lean mass by DEXA body composition analysis in 14-mo-old mice (n = 2 per group). (G) Analyses of brown adipose tissue and gonadal white adipose tissue in 14-mo-old mice (n = 3 per group). (H) qPCR analysis of thermogenesis markers and (I) qPCR assessment of adipogenesis and white fat tissue inducing transcripts in visceral fat of 14-mo-old mice (n = 4). (J) Sixteen-month-old mice chronically treated vs. control; heftier abdominal section and gray hairs are significant in control mice. (Left, Bottom) Total visceral white fat was dissected out from 16-mo-old mice visceral depot: visceral white fat accumulation in control model is markedly more than that of chronically treated mice and the difference in the color of adipose tissue in treated (brownish: higher mass of mitochondria) compared to control. All values are presented as mean ± SEM. Asterisks indicate statistical significance compared to control using unpaired t test and two-way ANOVA; ns, nonsignificant, (*P < 0.05; **P < 0.01; ***P < 0.001).

