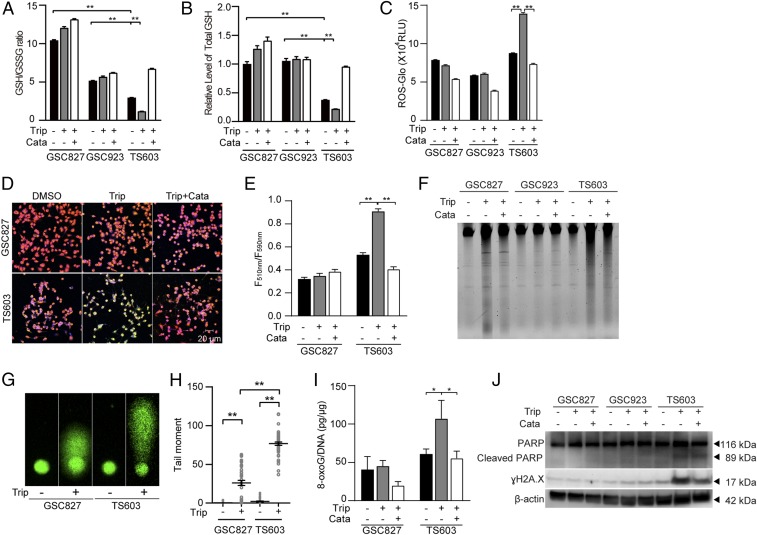
Fig. 5.
Triptolide disrupts ROS homeostasis and leads to oxidative DNA damage in IDH1-mutated cells. (A) GSH/GSSG ratio and (B) Total GSH quantification were measured using GSH/GSSG-Glo assay in BTIC lines (IDH1WT GSC827, IDH1WT GSC923, and IDH1R132H TS603 cells). n = 3. **P < 0.01. (C) ROS-Glo H2O2 assay of BTIC lines. n = 3. **P < 0.01. (D) Lipid peroxidation assay of BTIC lines. Before lipid peroxidation, the emission fluorescence showed at 590 nm (red). After lipid peroxidation, the emission fluorescence showed at 510 nm (green). (E) Lipid peroxidation was quantified using the ratio of F510 nm to F590 nm. n = 5. **P < 0.01. (F) Total genomic DNA electrophoresis analysis of BTIC lines after triptolide treatment. (G) The DNA fragmentation was measured by comet assay in BTIC lines after triptolide treatment. (H) Quantification of the tail moments in G. n = 50. **P < 0.01. (I) The 8-oxoG level was measured by oxidative DNA damage ELISA in BTIC lines. n = 3. *P < 0.05. (J) DNA damage was measured by immunoblotting of γH2A.X and cleaved PARP in BTIC lines. In this part, cells were treated with DMSO, 30 nM triptolide, or triptolide combined with 0.1 mg/mL catalase.

