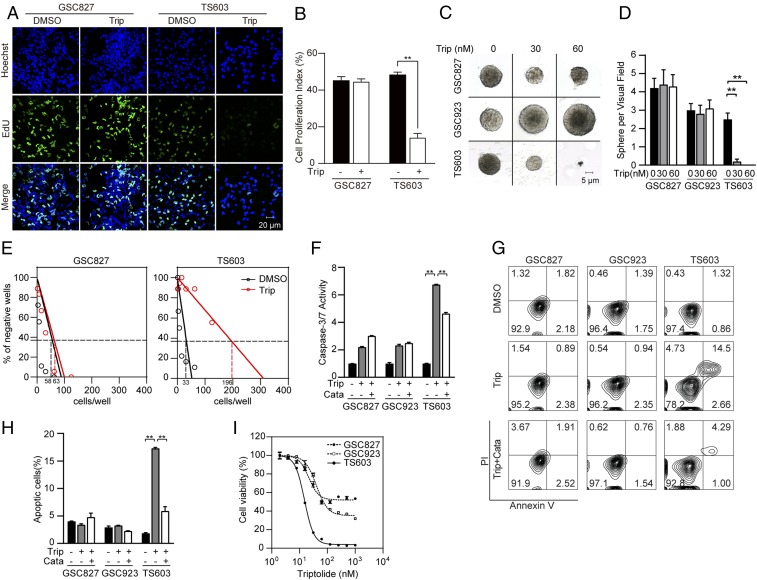
Fig. 6.
Triptolide selectively suppresses IDH1-mutated cells. (A) EdU (green) incorporation assay of BTIC lines (IDH1WT GSC827 and IDH1R132H TS603 cells) treated with DMSO or 30 nM triptolide for 24 h. Cell nuclei were labeled with Hoechst 33342 (blue). Bar = 20 μm. (B) Quantification of EdU positive cells in A. n = 10. **P < 0.01. (C) Sphere formation assay of BTIC lines treated with DMSO or triptolide. Bar = 5 μm. (D) The number of spheres was recorded. n = 10. **P < 0.01. (E) Limited dilution assay of BTIC lines treated with DMSO or 30 nM triptolide for 3 wk. The 0.37 intercept was labeled in dashed lines. (F) Caspase 3/7-Glo assay of BTIC lines with DMSO, 30 nM triptolide, or triptolide combined with 0.1 mg/mL catalase for 24 h. Luminescence was normalized to protein quantification. n = 3. Data are presented as mean ± SEM. **P < 0.01. (G) Annexin V/PI apoptosis analysis of BTIC lines with DMSO, 30 nM triptolide, or combined with 0.1 mg/mL catalase for 96 h. (H) Quantification of apoptotic cells from G. n = 3. **P < 0.01. (I) Cell viability assay shows the dose–response curve of triptolide in BTIC lines.

