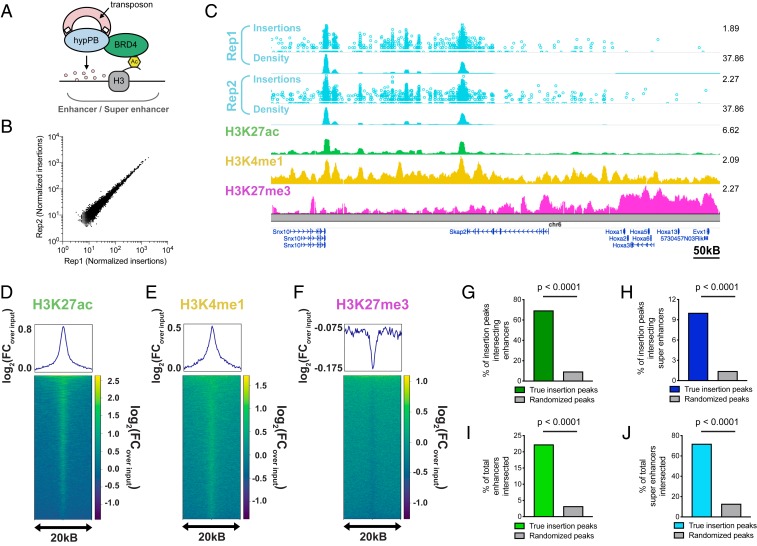
Fig. 2.
Unfused hypPB-directed calling cards insertions identify active enhancers and super enhancers in the brain. (A) Unfused hypPB endogenously interacts with BRD4 and is redirected toward sites of BRD4 occupancy, i.e., enhancers and super enhancers. (B) Normalized insertion totals in two littermate C57BL/6J mice (Rep1 and Rep2) at 7,031 significantly enriched insertion peaks (P < 10−30) displaying high correlation between replicates (R = 0.994). (C–F) Unfused hypPB-directed insertions are highly enriched for the active-enhancer marks H3K27ac and H3K4me1 and depleted for suppressive mark H3K27me3. Representative image (C), heat maps, and enrichment plots (D–F) of H3K27ac, H3K4me1, and H3K27me3 density at 7,031 significantly enriched insertion peaks in two littermate mice are shown. In C, the top track of each insertion replicate displays unique insertions, where each circle represents one unique insertion, the y axis represents the number of reads supporting each insertion on a log10 scale, and the bottom track displays normalized local insertion density across the genome (insertions per million per kilobase [kB]). The y axis of ChIP-seq data represents read depth with smoothing filter applied. Heat maps and enrichment plots are centered on insertion peaks and extend 10 kB in either direction. Relative enrichment quantifications displayed in log2(fold change over ChIP-seq input). (G and H) Percentage of 7,031 significantly enriched insertion peaks with at least 1 base pair (bp) intersection with a H3K27ac-marked enhancer or super enhancer. Gray bar represents intersections after randomizing genomic coordinates of insertion peaks. (χ2 test with Yates correction: P < 0.0001.) (I and J) Percentage of H3K27ac-marked enhancers and super enhancers with at least 1-bp intersection with a significantly enriched insertion peak. (χ2 test with Yates correction: P < 0.0001.)

