Fig. 4.
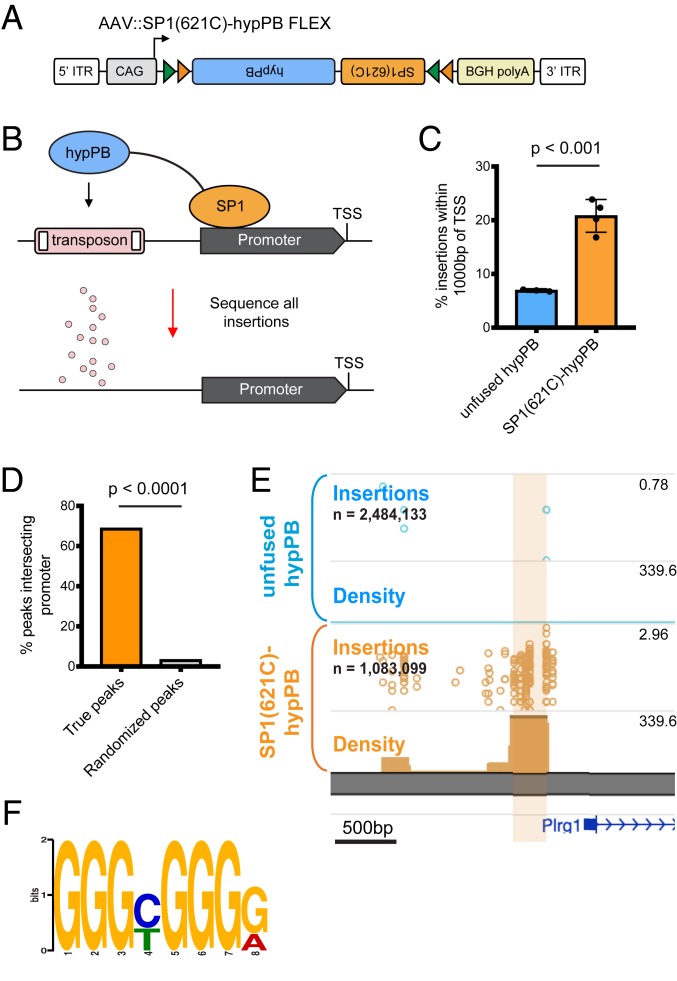
Fusion of SP1 to hypPB in AAV calling cards system records SP1 occupancy. (A) Schematic of AAV::SP1(621C)–hypPB FLEX construct. ITR, inverted-terminal repeat. (B) Fusion of the promoter-binding TF SP1 to hypPB directs insertions to promoter-proximal TTAA sites. (C) Percentage of total insertions within 1,000 base pairs (bp) of a TSS, displaying increased promoter-directed insertions upon SP1 fusion as compared with unfused hypPB (n = 3 to 4 mice per group; two-tailed, unpaired Student’s t test: P < 0.001, t = 7.66, degrees of freedom = 5, 95% CIdifference = 9.22 to 18.54; unfused hypPBmean = 6.9%, SP1[621C]–hypPBmean = 20.8%). Error bars represent SDs. Total SP1(621C)–hypPB insertions: 1,083,099; total unfused hypPB insertions: 2,484,133. (D) Percentage of significant SP1 insertion peaks differentially enriched over unfused hypPB (P < 10−15; 1,596 intersecting out of 2,316 total peaks) intersecting promoter-proximal regions (1,000 bp on either side of TSS) compared with randomized peak coordinates (78/2,316). χ2 test with Yates correction: P < 0.0001. (E) Representative insertion peak displaying significantly increased insertion density near the TSS of the Plrg1 gene. (F) Highest information-content motif in the sequences flanking the center of significantly enriched SP1(621C)–hypPB insertion peaks (P < 10−15) is the canonical SP1-binding motif (GGGCGGGG; P < 10−42).

