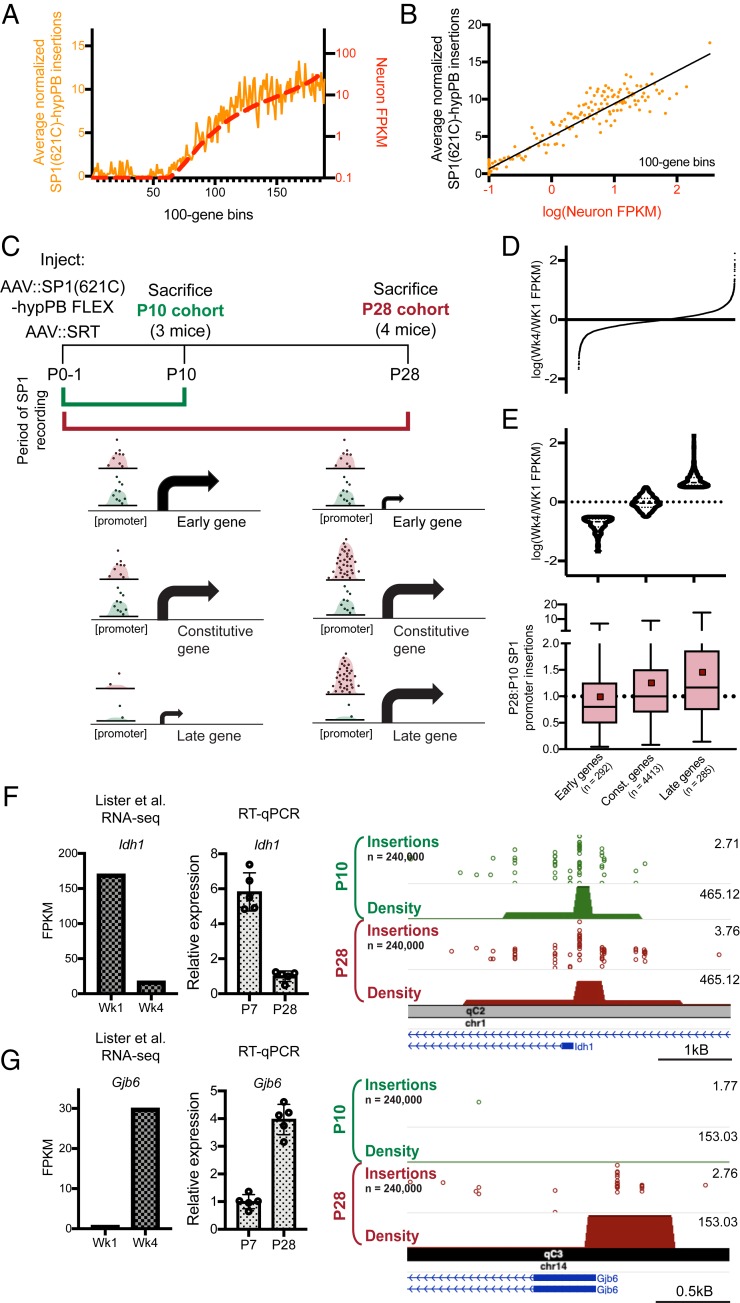
Fig. 5.
Longitudinal SP1 profiling reports integrated record of SP1 binding. (A and B) Normalized number of SP1(621C)–hypPB directed insertions at promoter-proximal regions after subtraction of unfused hypPB insertions, versus neuron-specific gene expression for all genes, binned and averaged into 100-gene bins. In A, the left y axis represents the number of promoter insertions normalized to 106 total insertions in the sample, and the right y axis displays neuron-specific RNA expression. Data from ref. 43. B displays strong correlation of SP1(621C)–hypPB promoter insertions with gene expression after subtraction of unfused hypPB insertions (R = 0.96, P < 0.0001). (C) Experimental paradigm and predicted temporal SP1 occupancy for early-, constitutive-, and late-expressing genes. (D) Distribution of Wk4/Wk1 expression ratios for all expressed and SP1-bound genes. (E, Top) Categorization of genes into “early” [log(Wk4/Wk1 FPKM) < −0.5], “constitutive” [−0.5 < log(Wk4/Wk1 FPKM) < 0.5], and “late” [log(Wk4/Wk1 FPKM) > 0.5] gene sets. Data from ref. 53. (E, Bottom) SP1-derived promoter insertions for early, constitutive, and late gene sets, demonstrating efficient capture of transient SP1-binding events at early gene promoters and continued integration of constitutive and late gene promoters in the P28 cohort relative to the P10 cohort. One-way ANOVA [F(2, 4,987) = 16.92], P < 0.0001. Early genesmean = 0.98, constitutive genesmean = 1.25, late genesmean = 1.45. Red squares represent means; solid lines represent medians. (F and G) Example of an early-expressed gene (Idh1) displaying equivalent SP1 binding in both cohorts (F) and a late-expressed gene (Gjb6) displaying SP1 binding only in the P28 cohort (G). The left bar graph displays reference RNA-seq read counts from ref. 53, while the right bar graph displays our own confirmatory RT–quantitative PCR (RT-qPCR) from brains of C57bl6/J mice at P7 and P28. Data from ref. 53.

