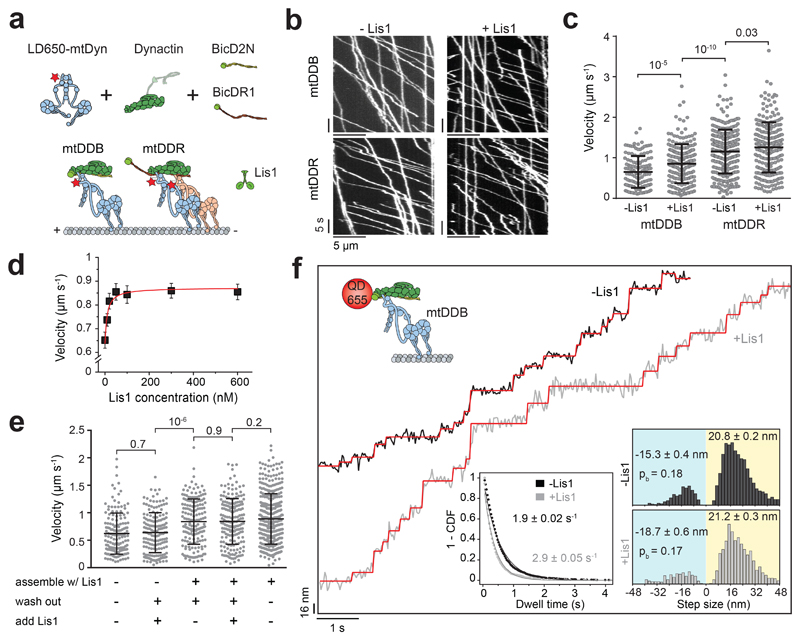
Figure 1. Lis1 increases the stepping rate of dynein-dynactin.
(a) Schematic depiction of the mammalian dynein-dynactin-cargo adaptor complexes. BicD2N primarily recruits single dynein to dynactin (DDB), whereas BicDR1 recruits two dyneins (DDR). Lis1 binds to the dynein motor domain. (b) Kymographs show the motility of mtDDB and mtDDR on MTs. (c) Velocity distribution of mtDDB and mtDDR with and without 600 nM Lis1. The centerline and whiskers represent the mean and SD, respectively. From left to right, n = 132, 217, 307, and 241, and mean values are 652, 854, 1155, and 1259 nm s-1. In a-c, four independent experiments were performed per condition. (d) The velocity of mtDDB under different Lis1 concentrations (mean ± SEM). mtDDB complex was assembled in the presence of Lis1, followed by removing excess protein and introducing Lis1 into the flow chamber. The red curve represents a fit to a Hill equation with n = 1. From left to right, n = 132, 216, 177, 204, 156, 179, and 217 (three independent experiments). (e) Velocity distribution of mtDDB assembled in the absence and presence of 600 nM Lis1 under different assembly conditions. The line and whiskers represent the mean and SD, respectively. From left to right, n = 152, 161, 170, 183, and 387 and mean values are 622, 638, 838, 842, and 888 nm s-1 (three independent experiments). (f) Step analysis of QD-labeled mtDDB (top insert) at 2 μM ATP in the presence and absence of 600 nM Lis1. Red staircases represent a fit to a step finding algorithm. (Bottom, left) Inverse cumulative distribution of dwell times between consecutive steps along the longitudinal axis. Solid curves represent fitting to an exponential decay (decay rate ± SE, n = 2138 for -Lis1 and 1441 for +Lis1). (Bottom, right) Normalized histograms of step sizes (n = 2,076 steps for -Lis1 and 1,374 for +Lis1, six independent experiments). Average forward and backward step sizes and the probability of backward stepping (pb) are shown (± SEM). In c and e, p values are calculated from a two-tailed t-test.

