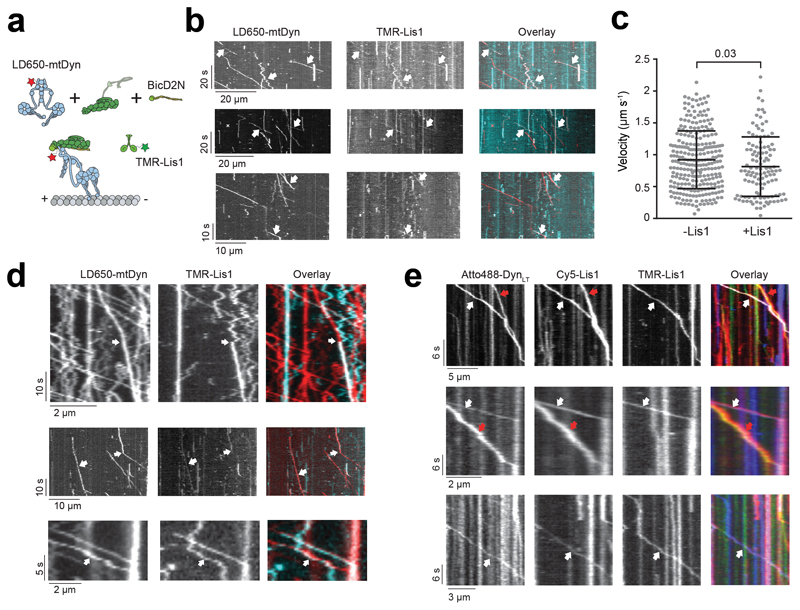
Extended Data Fig. 6. Additional examples of binding events of Lis1 to mtDDB and mtDTR during processive movement.
(a) Schematic depiction of mtDDB complex assembled in the presence of TMR-Lis1. (b) Representative kymographs show binding of Lis1 to motile mtDDB complexes assembled by mixing 1 nM LD650-mtDDB and 75 nM TMR-Lis1 and immediately recording motility with free proteins in solution (see methods). White arrows represent colocalization of LD650-Dyn (red) and Lis1-TMR (cyan). (c) Velocity distribution of mtDDB complexes not bound to Lis1 moves faster than complexes that are bound to Lis1 during single-molecule motility. The line and whiskers represent the mean and SD, respectively. From left to right, n = 270 and 117 and mean values are 921 and 813 nm s-1. In b and c, three independent experiments were performed per condition. The p-value is calculated from a two-tailed t-test. (d) Rare events of dynamic binding of Lis1 to dynein as mtDDB walks along an MT assembled in the presence of 50 nM Lis1. White arrows represent the colocalization of LD650-Dyn (red) and TMR-Lis1 (cyan). In the top kymograph, Lis1 initially diffuses on an MT and then binds to mtDDB during processive movement. Lis1 binding reduces the velocity of the complex. In the middle kymograph, dissociation of Lis1 during mtDDB motility increases the velocity. In the bottom kymograph, a diffusing Lis1 initially binds and later dissociates from mtDDB, without significantly affecting the velocity of the complex (four independent experiments). (e) Additional kymographs show single- and dual Lis1 binding to motile mtDTR complexes assembled in the presence of 50 nM Lis1. Red arrows represent the colocalization of Atto488-DynLT (green) and Cy5-Lis1 (red). White arrows represent the colocalization of Atto488-DynLT (green) with both Cy5-Lis1 (red), and TMR-Lis1 (cyan). Three independent experiments were performed per condition.

