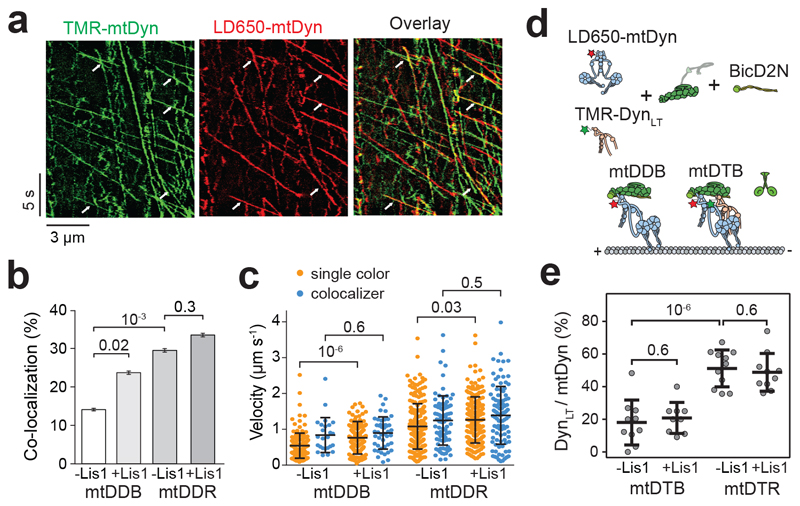
Figure 4. Lis1 favors the recruitment of two dyneins to dynactin.
(a) Representative kymographs show the motility of LD650- and TMR-labeled dynein in the presence of dynactin, BicD2N, and 600 nM Lis1. Arrows represent TMR and LD650 colocalization. (b) The percentage of processive complexes that contain both TMR and LD650 signals (mean ± SEM, n = 178, 190, 289, 290 from left to right). Error bars represent SE calculated from multinomial distribution and p-values are calculated from a two-tailed z-test. (c) Velocity distribution of single-colored and dual-colored complexes of DDB and DDR in the presence and absence of Lis1. The line and whiskers represent the mean and SD, respectively. From left to right, n = 153, 25, 145, 45, 204, 85, 193, and 97 and mean values are 544, 840, 766, 899, 1082, 1248, 1263, and 1390 nm s-1. p-values are calculated from a two-tailed t-test. In a-c, four independent experiments were performed per condition. (d) Schematic shows the assembly of mtDDB and mtDTB complexes using TMR-DynLT, LD650-mtDyn, dynactin, and BicD2N. (e) The ratio of processive runs by TMR-DynLT to LD650-mtDyn on individual MTs in the presence and absence of Lis1. The line and whiskers represent the mean and SD, respectively (n = 10, 9, 11, and 10 MTs from left to right, three independent experiments). p values are calculated from a two-tailed t-test.

