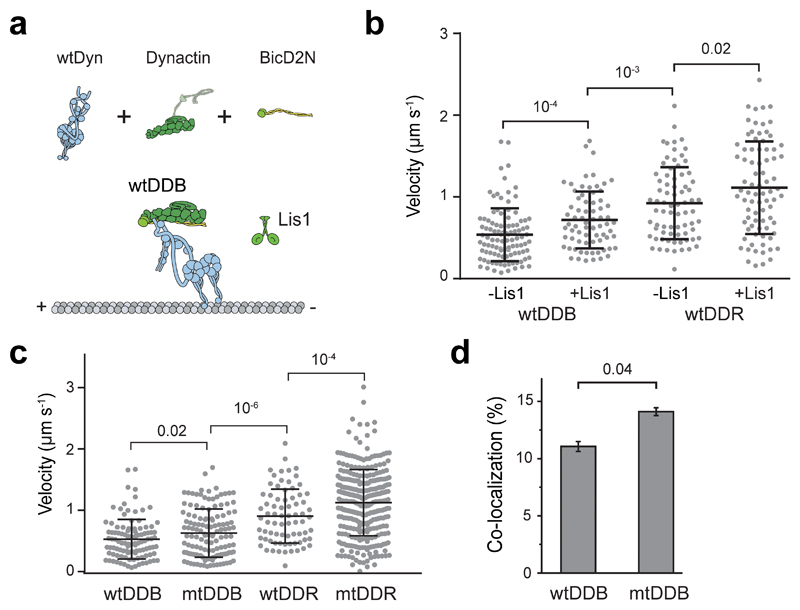
Extended Data Fig. 1. Lis1 increases the velocity of complexes assembled with wtDyn.
(a) Assembly of wtDDB and wtDDR. (b) Velocity distribution of wtDDB and wtDDR complexes assembled in the presence and absence of 600 nM Lis1. The line and whiskers represent the mean and SD, respectively. From left to right, n = 106, 72, 75, and 81, and mean values are 538, 718, 924, 1113 nm s-1 (three independent experiments). p-values are calculated from a two-tailed t-test. (c) Velocity distribution of complexes assembled with wtDyn and mtDyn in the absence of Lis1. The line and whiskers represent the mean and SD, respectively. From left to right, n = 106, 132, 75, and 307, and mean values are 538, 652, 924, 1155 nm s-1 (three independent experiments). p-values are calculated from a two-tailed t-test. (d) The percentage of processive wtDDB complexes that are dual-labeled when an equimolar mixture of TMR- and LD650-dynein motors were assembled with dynactin and BicD2N in the absence of Lis1 (mean ± SEM, n = 246 and 178 from left to right). Error bars represent SE calculated from multinomial distribution and the p-value is calculated from the two-tailed z-test.

