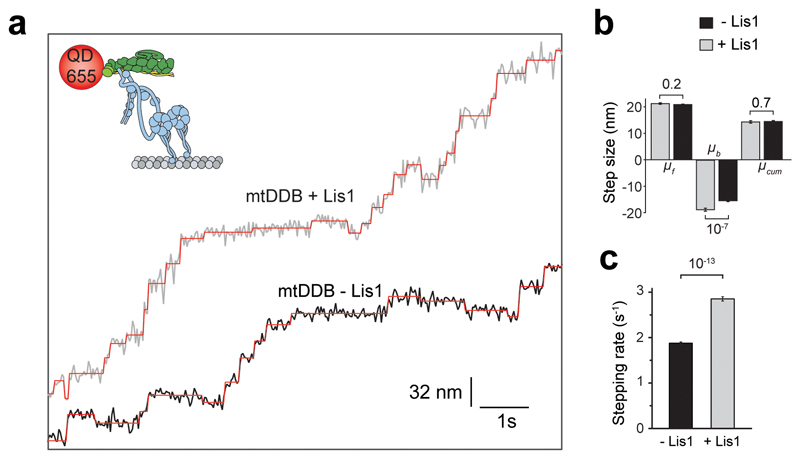
Extended Data Fig. 2. Step analysis of mtDDB in the presence and absence of Lis1.
(a) Additional examples of mtDDB stepping in the presence and absence of 600 nM Lis1. (b) The average size of steps taken in forward (μf), backward, (μb), and both (μcum) directions along the longitudinal axis of the MT. Error bars are SEM. In a and b, six independent experiments were performed per condition. (c) Stepping rates estimated from the exponential fit in Figure 1f. Error bars are SE of the fit. In b and c, p values are calculated from a two-tailed t-test; sample size (n) distribution of data are provided in Fig. 1f.

