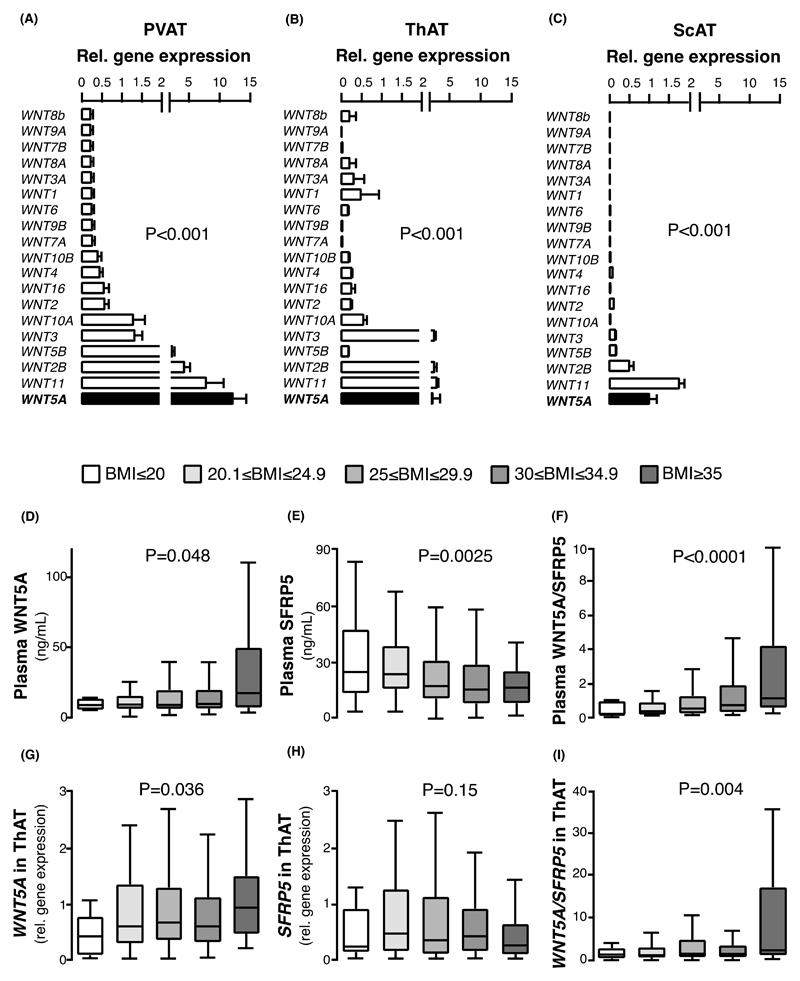
Fig. 1. Gene expression of Wnt ligands in adipose tissue and plasma concentration of WNT5A/SFRP5 in obesity.
(A-C) Gene expression of the 19 Wnt ligands in human (A) perivascular (PVAT), (B) thoracic (ThAT), and (C) subcutaneous (ScAT) AT in n = 54 patients of study 1. (D-F) Circulating plasma concentrations of (D) WNT5A (range: 1 to 112 ng/ml), (E) decoy receptor SFRP5, and (F) WNT5A/SFRP5 ratio in individuals of study 1. (G-I) Gene expression of (G) WNT5A, (B) SFRP5, and (C) the ratio of WNT5A/SFRP5 in ThAT of study 1 participants. Study 1 participants per group: BMI: ≤20Kg/m2: 25; 20.1-24.9 Kg/m2: 217; 25-29.9 Kg/m2: 432; 30-34.9 Kg/m2: 233; ≥35 Kg/m2: 57. Data are presented as mean ± SEM (A-C) or median [25th-75th percentile] (D-I). P values in (A-C) are calculated by Friedman tests; P values in (D-I) are calculated by Kruskal Wallis tests. AT: adipose tissue; SEM: Standard error of the mean.

