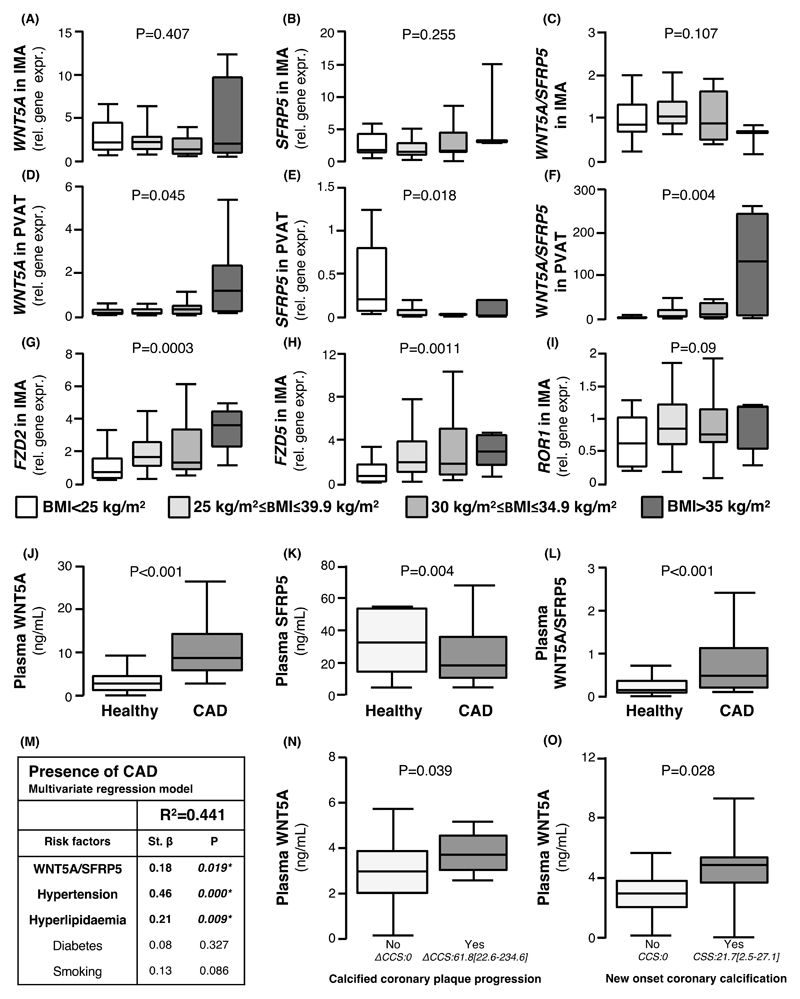
Fig. 2. Interactions between obesity, WNT5A/SFRP5, and vascular disease.
(A-C) Gene expression of (A) WNT5A, (B) SFRP5, and (C) the ratio of WNT5A/SFRP5 in IMAs according to BMI. (D-F) Gene expression of (D) WNT5A, (E) SFRP5, and (C) the ratio of WNT5A/SFRP5 in PVAT according to BMI. (G-I) Gene expression of Wnt receptors (G) FZD2, (H) FZD5, and (I) ROR1 in IMAs according to BMI. (J-L) Circulating plasma concentrations of (J) WNT5A, (K) SFRP5, and (L) WNT5A/SFRP5 ratio in patients with CAD and healthy controls (n = 70). (M) Table of multivariable regression analysis of the association of circulating WNT5A, SFRP5, WNT5A/SFRP5, cardiovascular risk factors, and the presence of CAD in study 2 (n = 70). (N) Plasma WNT5A concentration in patients with or without coronary calcium score (CCS) progression (ΔCCS≥1ΗU, 61.8 [22.6-234.6], n = 68, study 3). (O) Plasma WNT5A concentration in patients with or without new onset calcification (follow-up CSS:21.7[2.5-27.1], n=38). (N-O) presented as median [25th-75th percentile]. Data are presented as median [25th-75th percentile]. P values in (A-N) are calculated by Kruskal Wallis tests. Study 1 participants with IMA/PVAT samples available for panels A-I were: BMI<25Kg/m2: 33; 25-29.9Kg/m2: 77; 30-30Kg/m2:42; >35 Kg/m2:13. IMA: internal mammary artery; BMI: body mass index; PVAT: perivascular adipose tissue; CAD: coronary artery disease.

