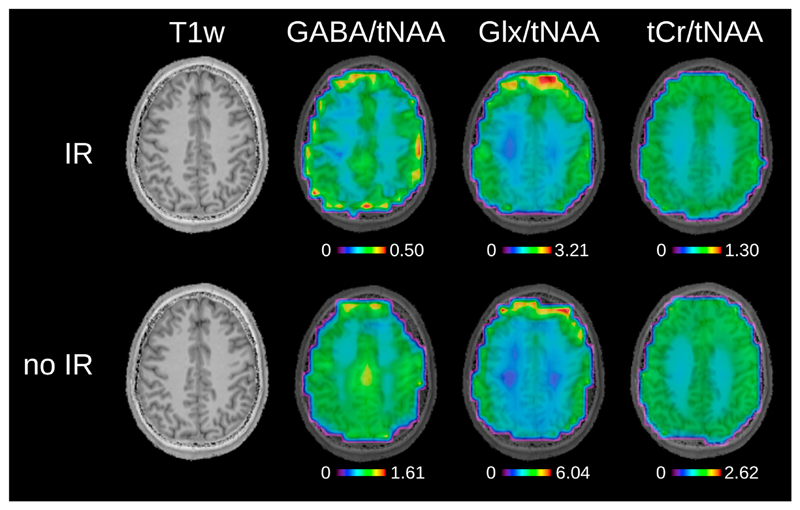
Fig. 6.
Metabolic ratio maps for inversion recovery ON and OFF for volunteer 1. T1-weighted images are shown, as well as GABA/tNAA and Glx/tNAA maps from DIFF spectra. tCr/tNAA maps are also provided and were obtained from EDIT-OFF spectra. The tNAA map from EDIT-OFF IR-ON spectra was used as normalization in all cases. Metabolic maps were acquired using the following MRSI settings: FOV 220 × 220 mm2; 32 × 32 matrix; slice thickness 16 mm; TA 24:12 min. The maps were interpolated to a 64 × 64 matrix for display.

