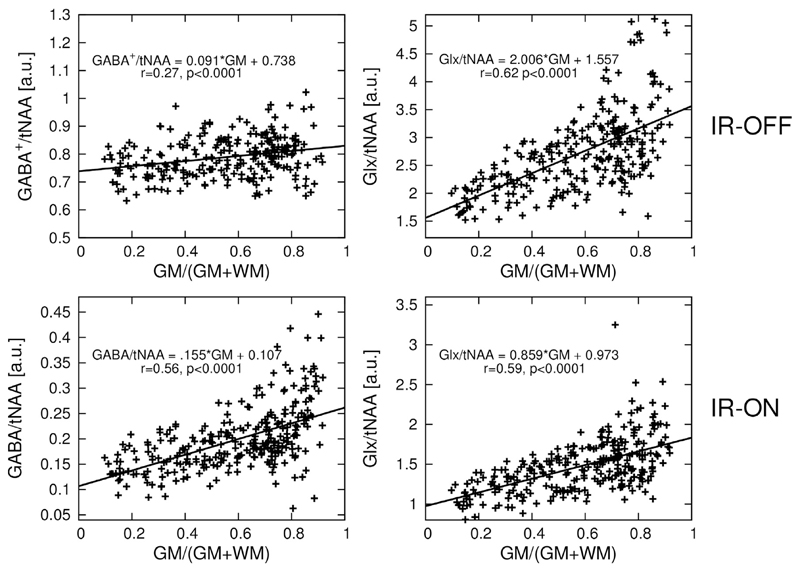
Fig. 8.
Linear regression plot of GABA/tNAA and Glx/tNAA versus gray matter tissue composition. tNAA obtained from EDIT-OFF IR-ON spectra was used as normalization in all cases. Linear regression equation, as well as r-value and p-values are provided. GABA/tNAA shows a signal decrease by a factor of ~4 in the case of IR-ON compared to IR-OFF (IR reduces the GABA signal by a factor of ~2 and eliminates MM contributions), while a factor of only ~1.7 in signal decrease is observed in the case of Glx/tNAA.

