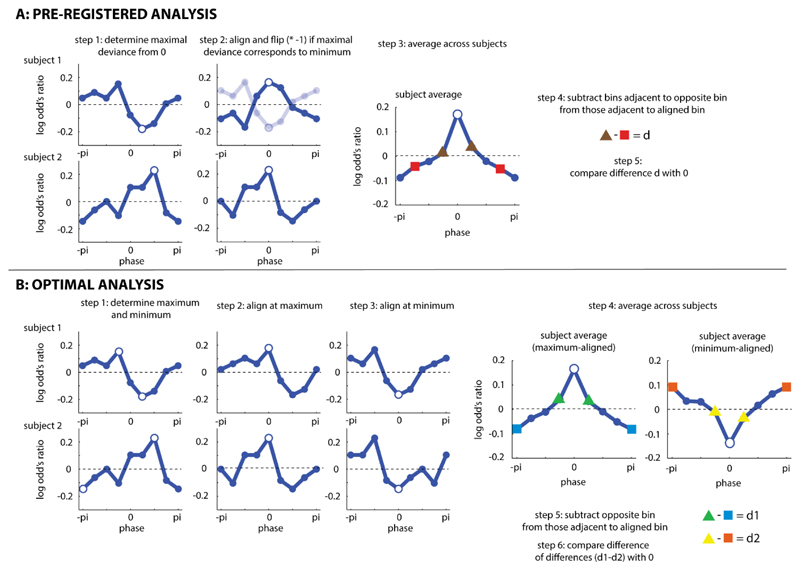
Figure 3. Statistical Protocols.
Both analyses (A: pre-registered analysis; B: optimal analysis, identified in Zoefel et al., 2019) are illustrated based on two (simulated) example subjects, and the average across 20 (simulated) subjects. Open circles show phase bins used for alignment. In all panels, the pi/-pi bin is plotted twice for visualization purposes.

