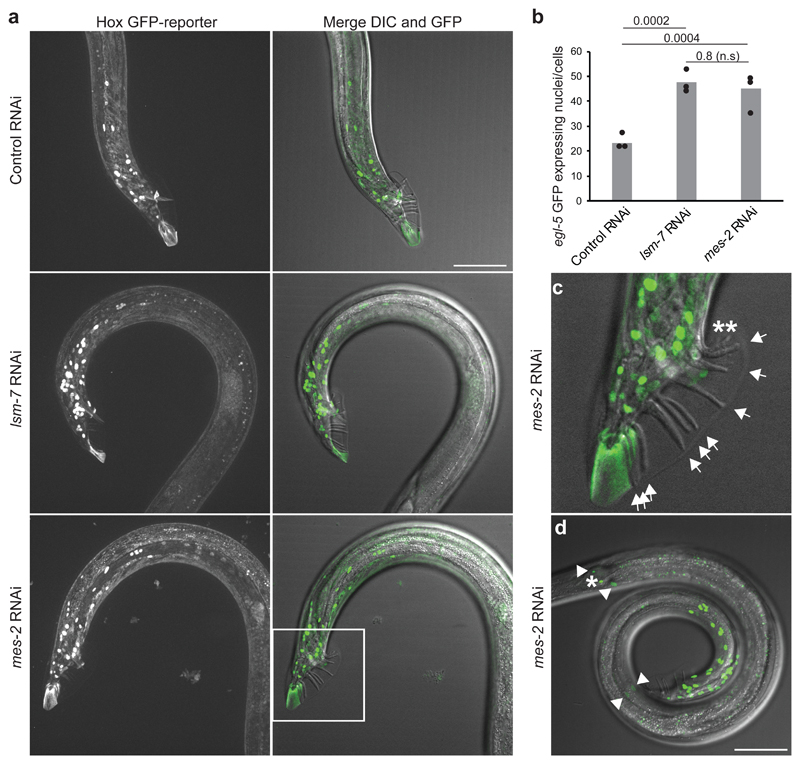
Figure 5. lsm-7, like the EZH2 homolog mes-2, is required to silence theegl-5 Hox gene.
a, On the left, Z-projection of confocal images showing the GFP fluorescence of the egl-5 GFP HOX reporter (bxIs13) under Control (mock/L4440) RNAi, lsm-7 and mes-2 (EZH2 homolog) RNAi conditions, in adult males. On the right, merged images of the Z projection of the GFP signal with the DIC image at the best focal plan to visualize the rays of the male tail. Bar, 50 μm. b, Quantification of the number of expressing egl-5 GFP nuclei/cells under the indicated RNAi conditions per proximal region of worms. P values indicated; two-tailed unpaired t test. Bars represent mean value derived from three independent experiments, with each experimental value shown as a dot. The three experiments examined 18, 19 and 17 worms in total for RNAi conditions indicated from left to right. c, Enlarged male tail inset as in (a) showing the 9 normal rays by arrows and an example of 2 ectopic abnormal rays in mes-2 (asterisks). d, egl-5 GFP derepression is observable mostly in male tail region, as in (a) but a few nuclei (0 up to 4, as shown by the arrowheads) could also exhibit this derepression in other regions of the worm in lsm-7 and mes-2 RNAi conditions. The nucleus indicated by an asterisk express egl-5 GFP in all conditions tested. Bar, 50 μm. Data shown in a, c, and d represent results from 3 independent experiments. Statistical source data are provided in Source Data fig. 5.

