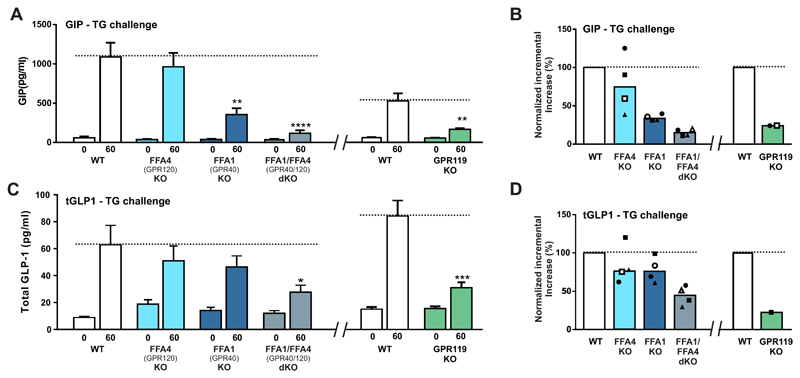
Fig. 2. Plasma GIP and GLP-1 responses to oral triglyceride challenge in mice – dependency on the metabolite receptors FFA1 (GPR40), FFA4 (GPR120) and GPR119.
Panel A - Plasma GIP levels before and 60 minutes after an oral gavage challenge with 10ml/kg of olive oil in FFA4 (GPR120), FFA1 (GPR40) and double deficient mice versus littermate wild type control mice (left panel) and in GPR119 deficient mice versus littermate control mice (right panel). A representative experiment with n=8-10 animals in each group is shown. The FFA1 and FFA4 deficient animals were taken from a breeding to obtain the double deficient animals and accordingly the joint littermate controls. Panel B – Mean GIP levels of four experiments similar to the one shown in panel A left panel (indicated in filled square symbols) except that in one experiment wild type C57BL/6 mice were used as controls (open symbols). In the right panel is shown the mean GIP response from two experiments with GPR119 deficient mice. Panel A - Plasma GLP-1 levels before and 60 minutes after an oral gavage challenge with 10 ml/kg of olive oil in FFA4 (GPR120), FFA1 (GPR40) and double deficient mice versus littermate wild type control mice (left panel) and in GPR119 deficient mice versus littermate control mice (right panel). A representative experiment with n=8-10 animals in each group is shown. The FFA1 and FFA4 deficient animals were taken from a breeding to obtain the double deficient animals and accordingly the joint littermate controls. Panel B – Mean GLP-1 levels of four experiments similar to the one shown in panel A (indicated in filled square symbols) except that in one experiment wild type C57BL/6 mice were used as controls (open symbols). In the right panel is shown the mean GLP-1 responses from two experiments with GPR119 deficient mice.

