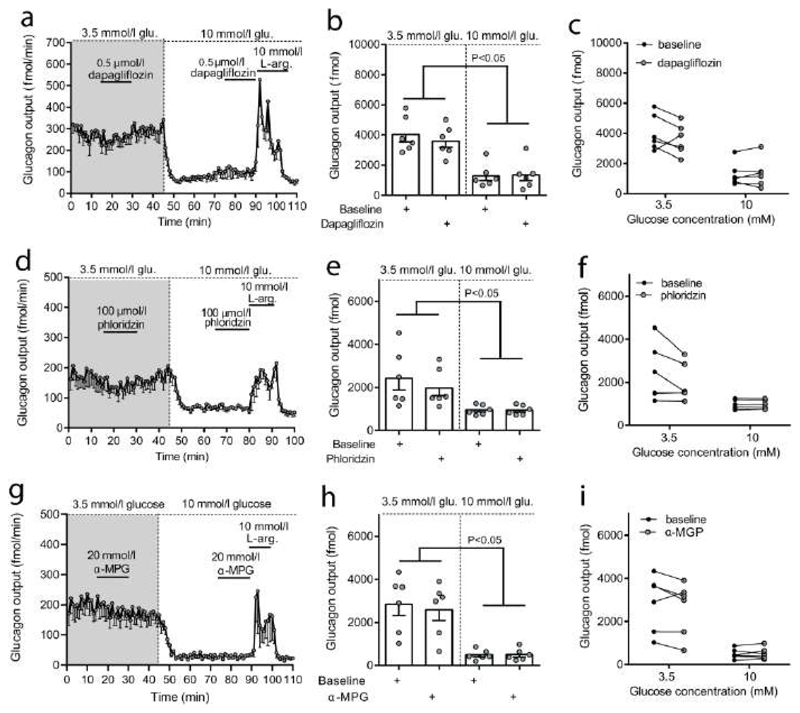
Figure 1. Effects of SGLT activity on glucagon secretion from isolated perfused rat pancreas.
Male Wistar rats were used. Data are shown as means ± SEM. A: Glucagon output (fmol/min) at 3.5 and 10 mmol/l glucose in absence or presence of dapagliflozin (0.5 µmol/l). B: Averaged total glucagon output (fmol) during dapagliflozin (0.5 µmol/l) administration (15 min) or at baseline (15 min immediately before stimulation), C: Connected glucagon outputs from individual animals. D-F: Same as A-C, respectively, but with administration of phloridzin (100 µmol/l)) rather than dapagliflozin. G-I: Glucagon output (fmol/min) in response to α-MGP (20 mmol/l; a SGLT-specific substrate). G: Total glucagon output during α-MGP administrations (15 min) or at respective baselines (15 min leading up to the respective administrations). L-arginine, a known glucagon secretagogue, was added at the end of all experiments to control for responsiveness (10 mmol/l, pos. control). n: = 6 for all, In B, E and H outputs from separate experiments are shown as dots. Statistical significance was tested by One-way ANOVA for repeated measurements followed by Bonferroni posthoc test. *p<0.05. Non-significant p-values: 3.5 mmol/l glucose: Baseline vs. dapagliflozin = 0.53, baseline vs. phloridzin = 0.29, baseline vs. α-MGP = 0.48, 10 mmol/l glucose: Baseline vs. dapagliflozin = 0.95, baseline vs. phloridzin = 0.71, baseline vs. α-MGP = 0.99.

