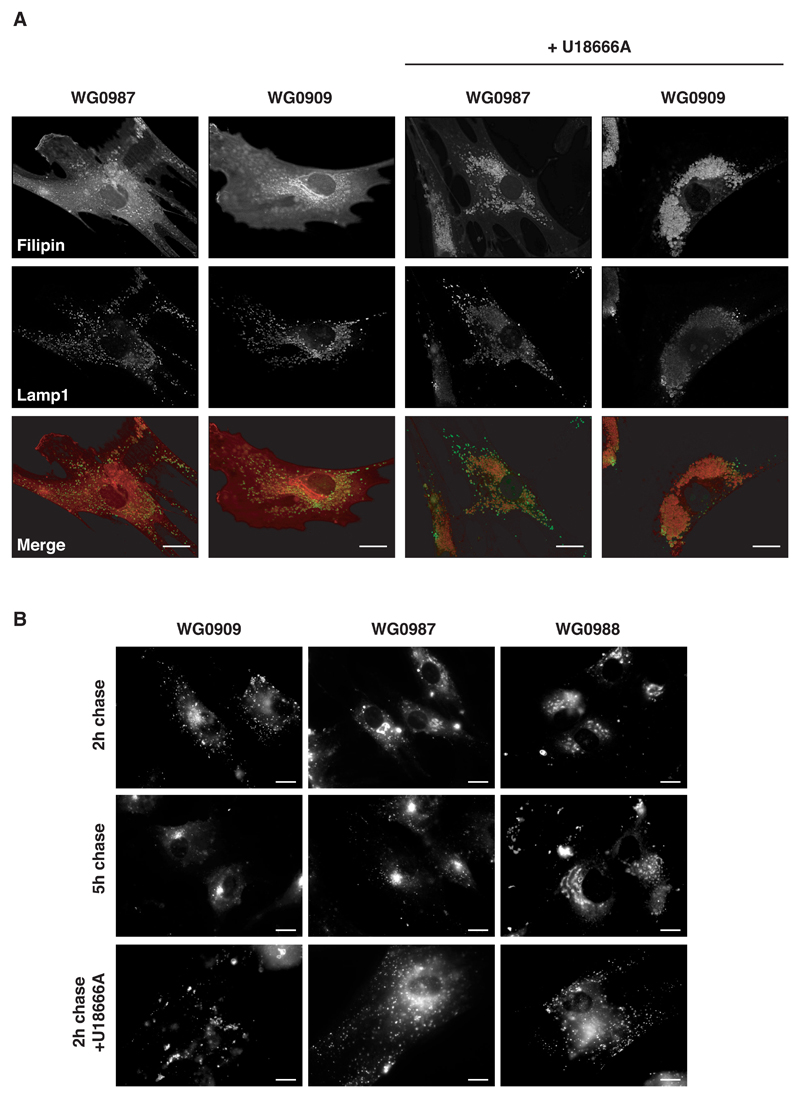
Figure 4. Cholesterol distribution and LacCer traffic kinetics.
(A) MLIV, WG0909 and parental, WG0987 cells treated for 24 h with or without U18666A were stained for unesterified cholesterol (filipin) and lamp-1. Merged pictures show lamp-1 (green) and filipin (red). Bars = 10 μm. (B) Parental and MLIV fibroblasts were pulsed for 1 h with LacCer and then chased for either 2 or 5 h (top and middle panels respectively). Cells treated for 24 h with U18666A were also pulsed for 1 h with LacCer and then chased for 2 h (bottom panels). Bars = 10 μm.

