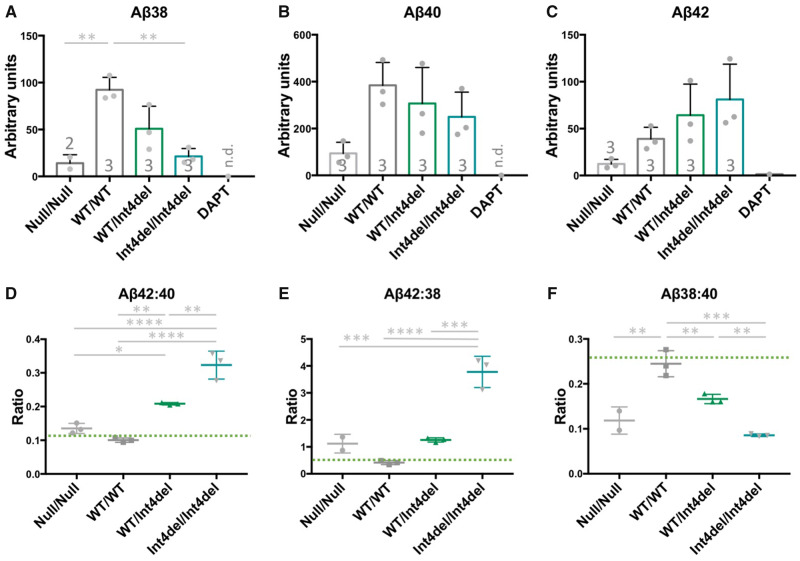
Figure 4.
Aβ analysis in iPSC-neuronal-conditioned media. (A–C) Quantification of Aβ38, Aβ40 and Aβ42 in 48 h-conditioned media from neurons at day 100, measured by electrochemiluminescence and normalized to total protein content from the cell pellet. The DAPT sample is a representative unrelated control line treated with 10 μM of the γ-secretase inhibitor DAPT for 48 h; n.d., not detected. Numbers within histograms represent the number of independent neural inductions. (D–F) Aβ ratios to depict the disease-associated Aβ42:40 ratio, γ-secretase carboxypeptidase-like activity Aβ42:38 and endopeptidase cleavage position choice Aβ38:40. n=3 for each sample apart from where Aβ38 was below detection limit for one null/null sample. Green bars represent non-Alzheimer’s disease neuronal ratios from Arber et al. (2019). *P > 0.05, **P > 0.01, ***P > 0.001 and ****P > 0.0001 by one-way ANOVA with Tukey’s post hoc analysis.

