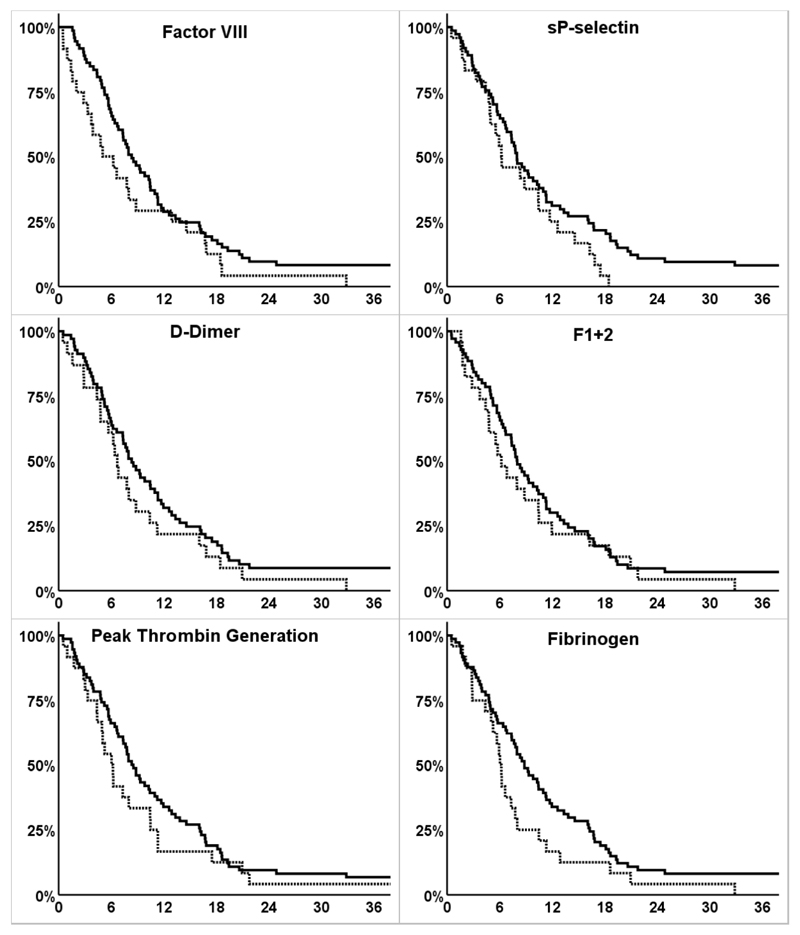
Figure 2. Survival functions of progression free survival according to dichotomized biomarkers.
y-axis: cumulative progression free survival in percent (%), x-axis: progression free survival (time from study inclusion to progression of disease) in months; continuous line: survival function of patients with biomarker ≤75th percentile; dotted line: survival function of patients with biomarker >75th percentile; crosses indicate data censoring

