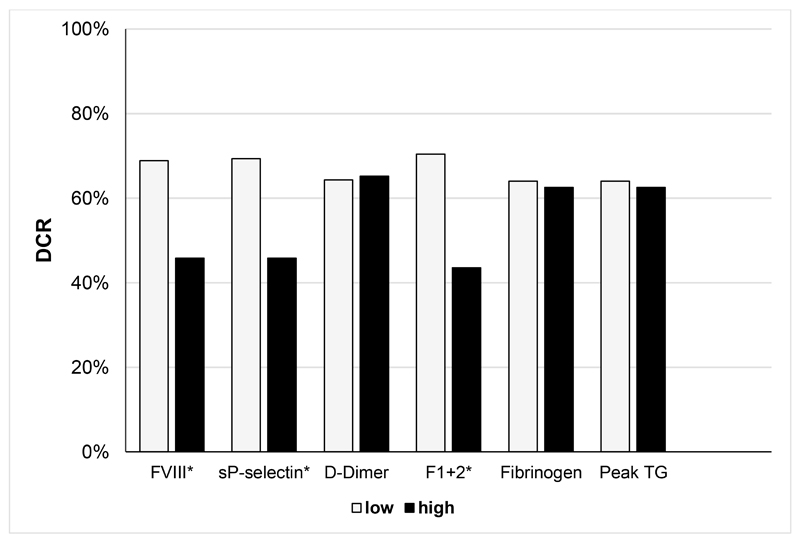
Figure 3. Disease control rate (DCR) according to dichotomized biomarkers.
y-axis: percentage of patients who achieved disease control during first line systemic chemotherapy; x-axis: Haemostatic biomarkers, dichotomized at the 75th percentile of level distribution (low: ≤75th percentile, high: >75th percentile). Asterisk (*) indicates statistically significant difference in DCR; Abbreviations: DCR: disease control rate; FVIII: Factor VIII sP-selectin: soluble p-selectin; F1+2: prothrombin fragment F1+2; peak TG: peak thrombin generation

