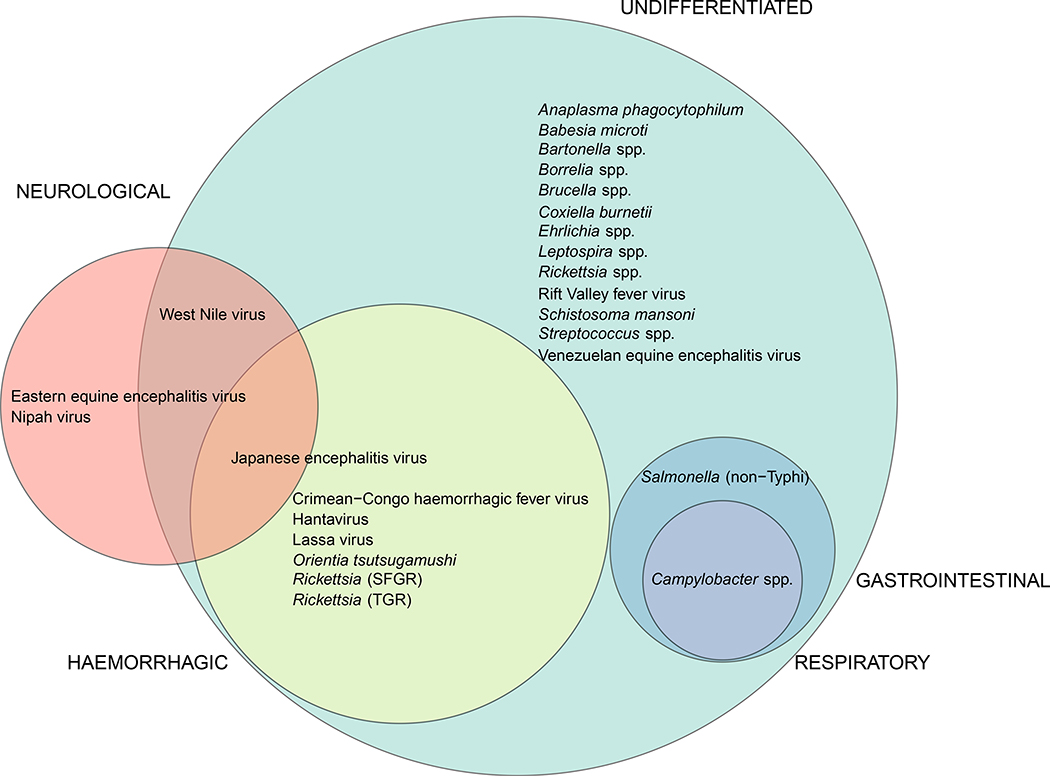
Figure 5:
Venn diagram illustrating the associations between febrile population clinical presentation and pathogens identified.
Circles are scaled to the number of pathogens detected in each type of febrile population. Undifferentiated, shown in green, 23 pathogens (including pathogens also seen in other populations); febrile neurological, shown in red, four pathogens; febrile gastrointestinal, shown in blue, two pathogens; febrile respiratory, shown in purple, one pathogen, febrile haemorrhagic, shown in yellow, seven pathogens. Five pathogens are not represented in the figure as they were only detected in febrile populations classified as co-morbid (Listeria spp., Pasteurella spp. and Toxoplasma gondii) or in febrile populations with a specific febrile aetiology suspected (Leishmania donavani, and Yersinia pestis).

