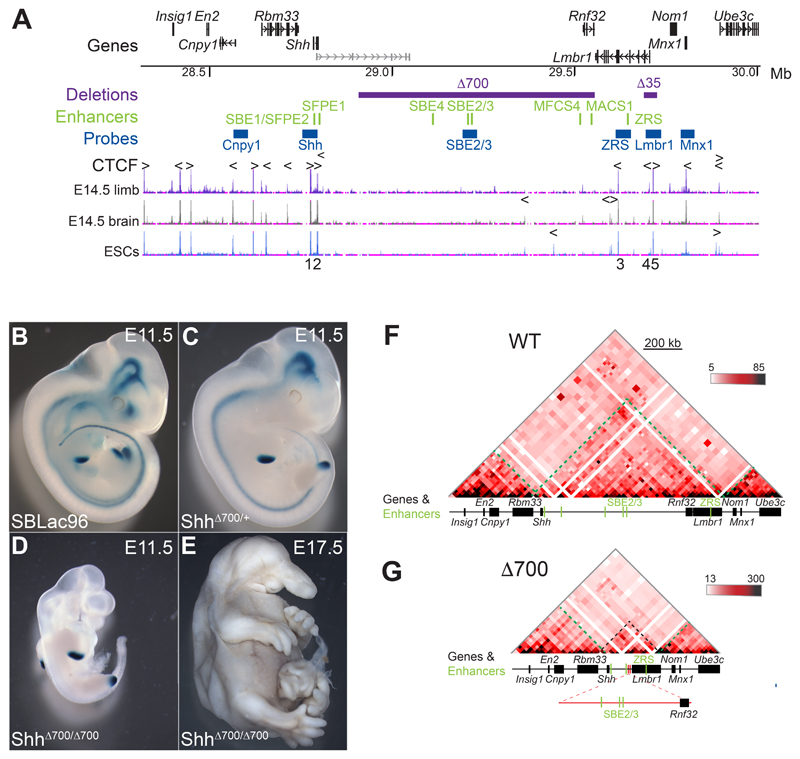
Figure 1. A 700-kb intra-TAD deletion has no adverse effects on limb-specific expression of Shh.
(A) (Top) Location of genes in the 1.7 Mb murine genomic locus (chr5: 28317087-30005000; mm9) containing Shh analysed by 5C and FISH, with the position of tissue-specific Shh enhancers shown below in green. Locations to which the fosmid FISH probes hybridize are shown in blue, and the purple bars indicate deleted genomic regions (Δ700 and Δ35). The bottom three tracks show UCSC ENCODE CTCF ChIP-seq profiles in E14.5 limb buds, brain and in ESCs. Arrowheads above the tracks indicate the orientation of CTCF-binding motifs and the deleted CTCF binding sites (1-5) are numbered below. (B-D) Staining for the LacZ reporter gene carried by the sleeping beauty transposon in E11.5 embryos, (B) carries the intact SBLac96 insertion (Anderson et al, 2014) while (C) shows the remaining sites of expression after Cre mediated deletion of 700Kb (purple bar in A) and (D) shows the phenotype of an embryo homozygous for the 700kb deletion, with LacZ staining only evident in the ZPA of the limb buds. A homozygous deletion embryo (E) at E17.5 showing craniofacial and brain defects but normally formed limbs. (F and G) 5C heat-maps from cells of the bodies of E11.5 wild-type embryos (F) and embryos homozygous for the 700kb deletion (G). Heat map intensities represent the average of interaction frequency for each window, binned over 21kb windows, with read counts summed from two biological replicates and colour-coded according to the scale shown. Green dashed lines highlight TAD boundaries, black dashed lines indicate the Shh TAD boundaries and the reduced size of the TAD. Data for individual biological replicates are in Figure S1.

