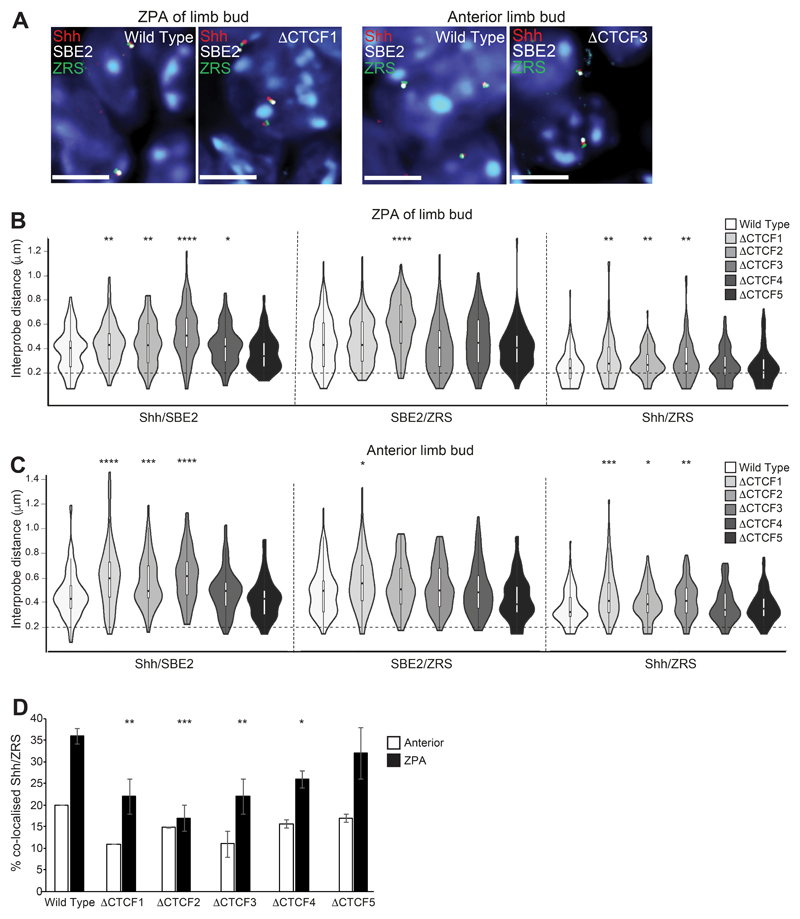
Figure 5. Perturbation of chromatin conformation within theShhTAD in the distal limb bud of ΔCTCF mutant embryos.
(A) Images of representative nuclei from E11.5 ZPA and distal anterior limb bud in wild type, ΔCTCF1 and ΔCTCF3 embryos showing FISH signals for Shh/SBE2/ZRS probes. Scale bars = 5 μm. (B) & (C) Violin plots show the distribution of interprobe distances (μm) between Shh/SBE2, SBE2/ZRS and Shh/ZRS probes in E11.5 wild type and ΔCTCF mutant embryos in (B) ZPA/distal posterior and (C) distal anterior limb bud. Horizontal dashed lines show the proportion of alleles that are colocalised (< 200 nm). The statistical significance between data sets was examined by Mann-Whitney U Tests, * < 0.05, ** < 0.01, *** < 0.001, **** < 0.0001. (D) Histograms show the percentage of colocalised Shh/ZRS probe pairs (<200nm) in wild type and each of the ΔCTCF E11.5 embryos for distal anterior and ZPA limb bud tissue. Error bars represent SEM obtained from two or three different tissue sections. The statistical significance between data sets was examined by Fisher’s Exact Tests, * < 0.05, ** < 0.01, *** < 0.001.

