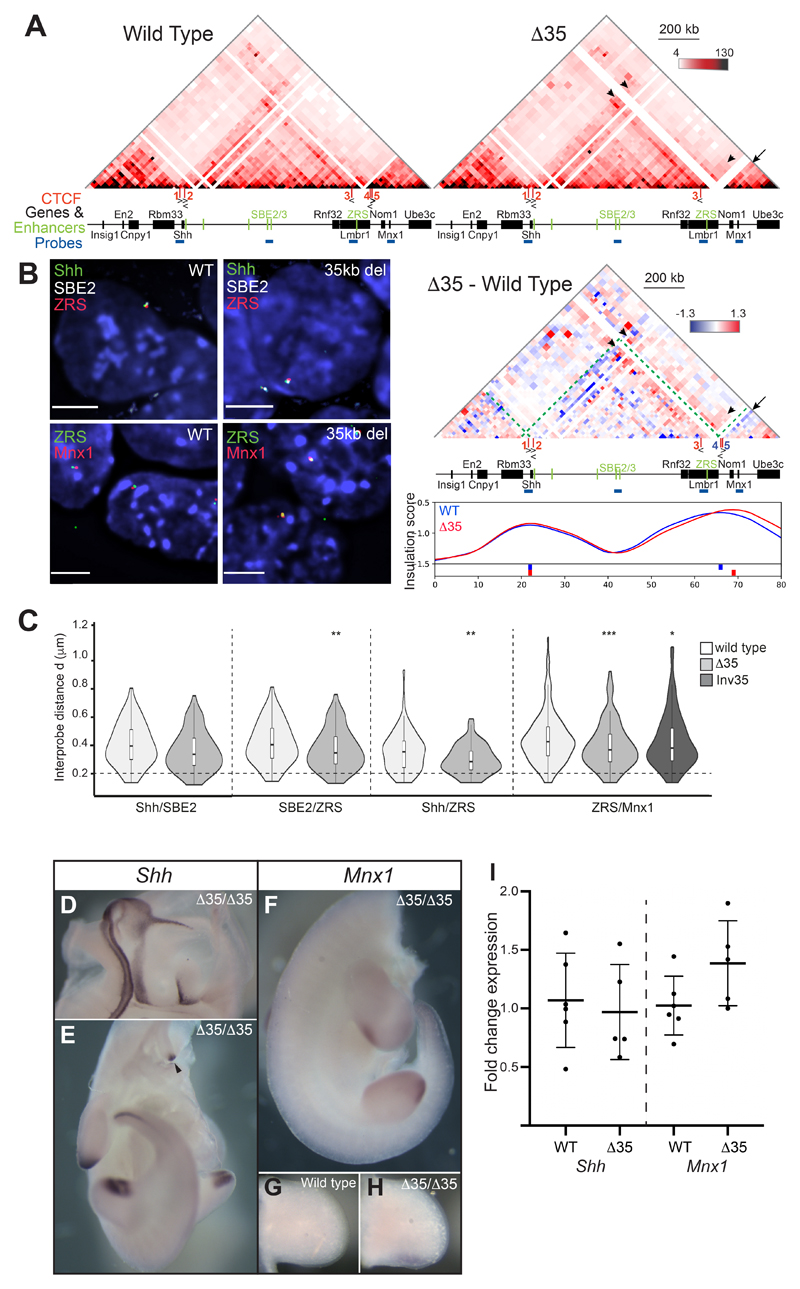
Figure 7. Chromosome conformation and gene expression as a consequence of a 35-kb deletion (Δ35) at the Lmbr1 TAD boundary.
(A) 5C heat maps from wild type and Δ35 ESCs. Below is a heat map comparing Δ35 5C enrichment (red) with wild type (blueGreen dashed lines indicate the Shh TAD boundaries, black arrows highlight loss of interactions in Δ35 cells and black arrowheads indicate enriched interactions in Δ35 cells. At the bottom are insulation score graphs that identify the location of TAD boundaries using raw summed 5C matrices. Peaks of insulation are shown below the plots, Δ35 (red) and wild type (blue). Data for biological replicates are in Supplemental Fig. S6. (B) Images of representative nuclei from wild type and Δ35 ESCs showing FISH signals for Shh/SBE2/ZRS and ZRS/Mnx1 probes. Scale bars = 5 μm. (C) Violin plots show the distribution of interprobe distances (μm) between Shh/SBE2, SBE2/ZRS, Shh/ZRS and ZRS/Mnx1 probes in wild type and Δ35 ESCs, and ZRS/Mnx1 distances in 35kb inversion ESCs. Horizontal dashed line shows the proportion of alleles that are colocalised (< 200 nm). The statistical significance between data sets was examined by Mann-Whitney U Tests, * < 0.05, ** < 0.01, ** < 0.001. (D & E) In situ hybridisations showing normal Shh expression in a bisected head and body, respectively, of a Δ35/Δ35 E11.5 embryo. (F-H) In situ hybridisations for Mnx1 in a Δ35/Δ35 homozygote (F) and limb bud (H) and for comparison lower levels of staining in a wildtype limb bud is shown in (G). The staining in (G) and (H) was stopped before wildtype signal was apparent to highlight Mnx1 up-regulation. (I) Fold change of Shh and Mnx1 expression determined by qRT-PCR of cDNA made from E11.5 limb buds. Mutants Δ35/Δ35 embryos are compared to wildtype litter mates. Each dot represents a single embryo and data is graphed as mean +/- SD. The statistical significance between data sets was examined using unpaired Student t-tests.

