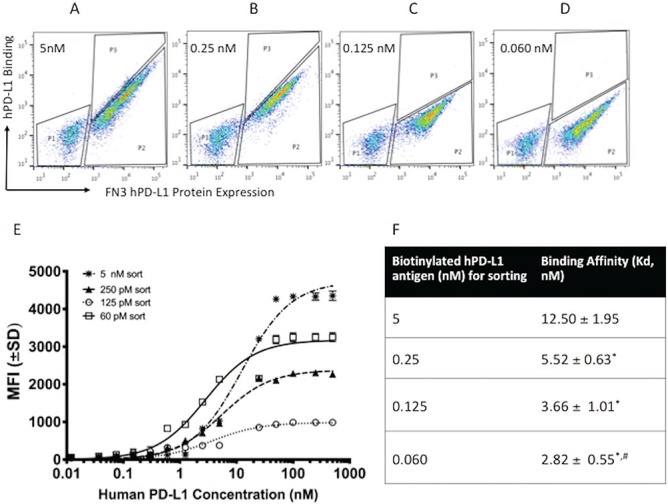
Fig. 1.

Enrichment of yeast populations for hPD-L1 binders after 4 rounds of affinity maturation. (A) Yeast cells were enriched with 5 nM of the biotinylated hPD-L1 antigen. Clones with high expression of hPD-L1 were sorted (P3 populations). (B) Sorted population from 5 nM were enriched further with 0.25 nM of the biotinylated hPD-L1 antigen. Populations within P3 gate (top 2% of total population) were sorted. (C) Sorted population from 0.25 nM were enriched further with 0.125 nM of the biotinylated hPD-L1 antigen. Populations within P3 gate (top 1% of total population) were sorted. (D) Sorted population from 0.125 nM were enriched further with 0.06 nM of the biotinylated hPD-L1 antigen. Populations within P3 gate (top 1% of total population) were sorted. (E) Binding dynamics of the yeast populations from each round of sorting at 5, 0.25, 0.125 and 0.06 nM at different concentrations of purified hPD-L1. The mean fluorescence intensity (MFI) values of each sample were measured by FACS. Error bars represent S.D. for duplicate samples. (F) Binding affinities (Kd) of the yeast from each round of sorting. *P < 0.05 relative to first round of sorting. #P < 0.05 relative to second round of sorting.
