Fig. 3.

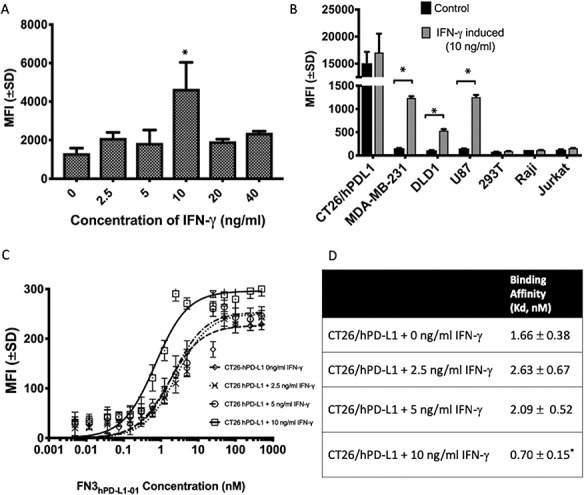
Detection of cell-surface hPD-L1 in CT26/hPD-L1 cells using the FN3hPD-L1-01 binder. (A) Dose response of IFN-γ for induction of hPD-L1 expression on CT26/hPD-L1 cells as measured by mean fluorescence intensity (MFI). Highest expression of hPD-L1 was achieved at 10 ng/ml of IFN-γ. Error bars represent S.E.M from duplicate samples. *P < 0.05 relative cells without induction. (B) Expression of hPD-L1 in different human cancer cell lines upon induction with 10 ng/ml IFN-γ. Except for CT26/hPD-L1, the basal levels of hPD-L1 expression across six cell lines were low. When induced with IFN-γ, CT26/hPD-L1 showed the highest expression of hPD-L1 when compared to other cell lines. MDA-MB-231, U87 and DLD-1 showed IFN-γ-induced expression of hPD-L1. However, 293 T, Raji and Jurkat did not show any expression of hPD-L1 even with IFN-γ induction. Error bars represent S.D. from duplicate samples. *P < 0.05. (C) Binding dynamics of FN3hPD-L1-01 in CT26/hPD-L1 cells induced with different concentrations of IFN-γ. Error bars represent S.D. from duplicate samples. (D) Binding affinity (Kd) decreased as the expression of hPD-L1 increases with IFN-γ.*P < 0.05 relative to non-induced CT26/hPD-L1 cells.
