Figure 3.

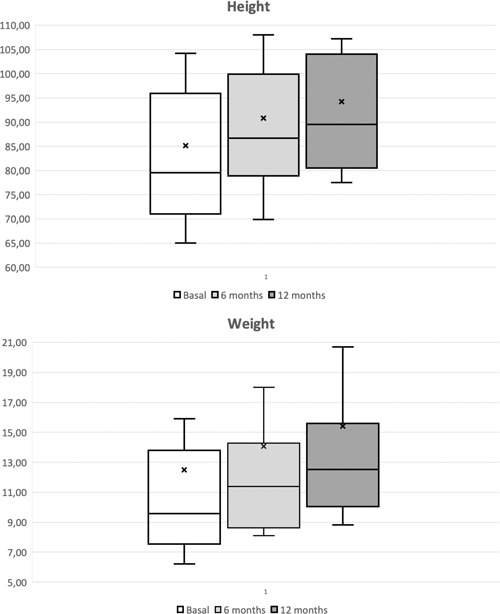
Box and whisker plot showing weight (kg) and height (cm) increase after 6 and 12 months. The bars, box, and whiskers indicate the medians, 25th and 75th centiles and the ranges, respectively

Box and whisker plot showing weight (kg) and height (cm) increase after 6 and 12 months. The bars, box, and whiskers indicate the medians, 25th and 75th centiles and the ranges, respectively