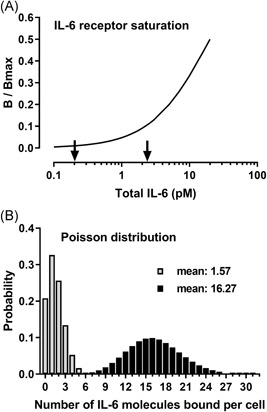
Figure 3.

A, Cellular IL‐6 receptor saturation, B/B max, as a function of total IL‐6. Calculations were performed using the data from Figure 2 and the formula described in Section 2. The two arrows indicate total rhIL‐6 concentrations at which cellular dehydrogenase activity was statistically significantly higher (P < .01) compared with that of unstimulated cells (0.2 pM) and the lowest total rhIL‐6 concentration that gave rise to maximal dehydrogenase activity (2.3 pM). B, The Poisson distributions for means 1.57 and 16.27. Five thousand B9 cells in 110 µL of media, with each cell having on average 164 binding sites for IL‐6, give rise to a B max of 0.012 pM. The binding affinity, Kd, was set at 20 pM. A significant bioresponse was observed at an IL‐6 concentration of 0.2 pM. The cellular IL‐6 binding at this concentration was calculated to be 12 × 10−5 pM, corresponding to 7867 IL‐6 molecules bound in total or an average of 1.57 IL‐6 molecules bound per cell. The same calculation performed at an IL‐6 concentration of 2.3 pM resulted in a cellular IL‐6 binding of 124 × 10−5 pM, corresponding to 81 385 IL‐6 molecules bound in total or an average of 16.27 IL‐6 molecules bound per cell. The Poisson distributions for means 1.57 and 16.27 are shown, which equal the probability (or the proportion) of cells that have bound the indicated number of IL‐6 molecules. rhIL‐6, recombinant human interleukin‐6
