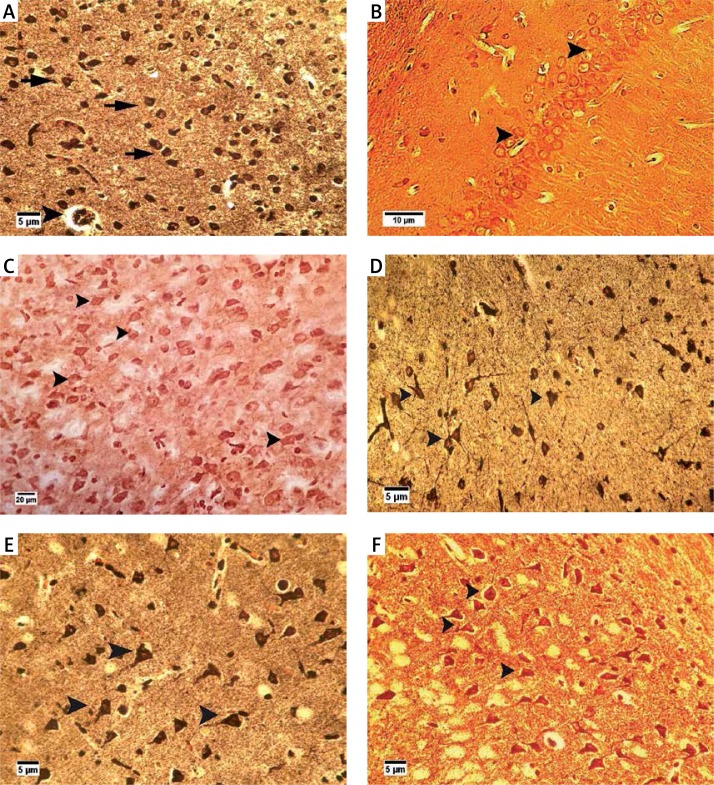
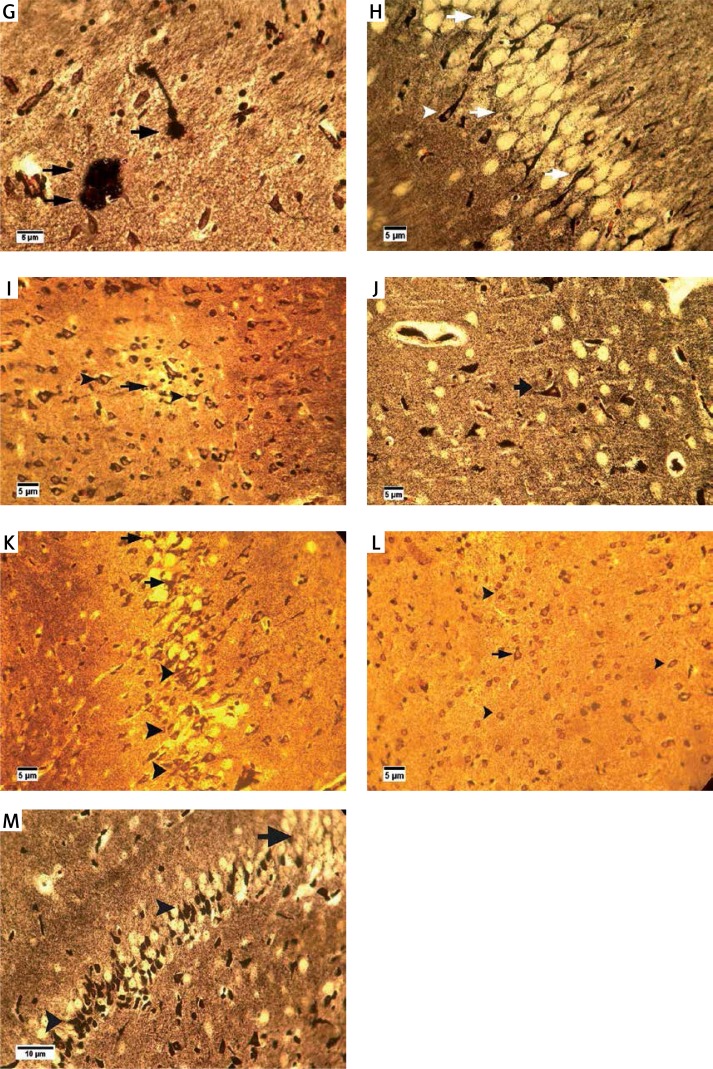
Figure 3.
Bielschowsky staining in cerebral cortex and CA1 region of hippocampus. Cerebral cortex in normal control group (A) showed normal neuronal cell body (arrow) and vessels (arrowhead). CA1 of hippocampus in normal control group (B) showed normal neuronal cell (arrowhead) population. Sham-operated group (C) revealed normal neuron (arrowhead) in the cortex. Normal rats administered β-asarone at doses of 12.5 (D), 25 (E), and 50 (F) mg/kg revealed a normal neuronal cell body (arrowhead). Alzheimer’s control group revealed neuritic plaques (arrow) in cerebral cortex (G) and in CA1 (H). Also, loss of neuronal cell population (arrow) and neurofibrillary tangles (arrowhead) was seen. β-asarone at dose of 12.5 mg/kg (I) led to moderate neurofibrillary tangles (arrowhead) and neuronal necrosis (arrow) in Alzheimeric rats. Administration of β-asarone at doses of 25 (J), 50 (L) mg/kg revealed few neurofibrillary tangles (arrow) in cortex, improved neuronal population (arrowhead) and decreased neuronal necrosis (arrow) in CA1 (K, M)


