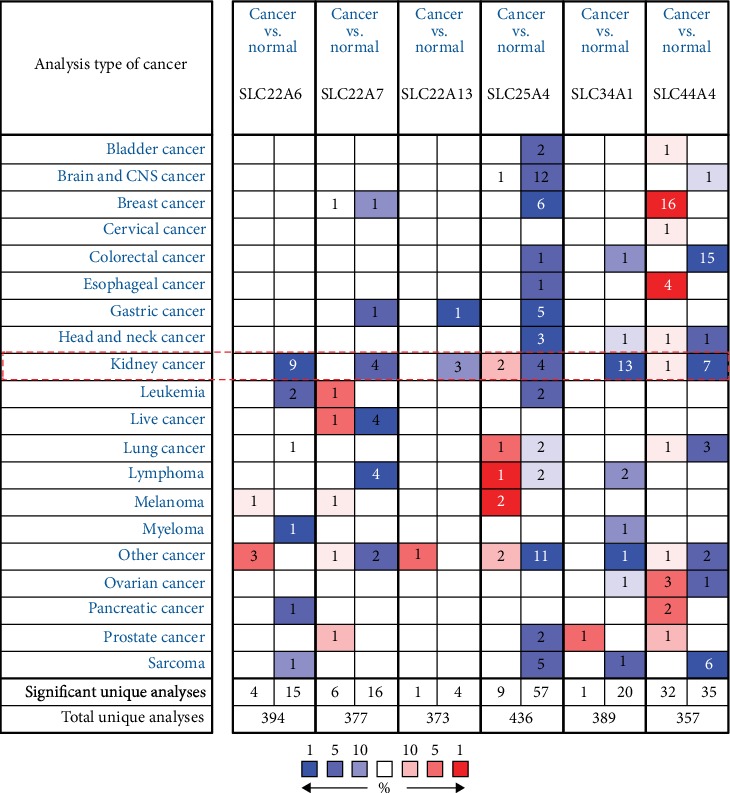
Figure 2.

The expression levels of SLC family genes in pancancer (cancer vs. normal). The degree of cell color was determined by the best gene rank percentile. Red represented overexpression and blue represented underexpression. The number in the cell indicates the number of datasets that reached the threshold in the corresponding datasets of cancers.
